A Digital Twin and Bayesian Network Integrated Framework for Dynamic Resilience Assessment and Optimization of Urban Transportation Infrastructure
Hongbo Qin1, 2,*, Ahui Niu1, Yifei Li3 and Wanyun Xia2
1Henan Justice Police Vocational College, Zhengzhou, China
2Zhengzhou University, Zhengzhou, China
3Henan University, Zhengzhou, China
E-mail: qinhongbo@hnsfjy.edu.cn; niuahui@hnsfjy.edu.cn; 1109670803@qq.com; xiawanyun@zyic.com
*Corresponding Author
Received 04 September 2025; Accepted 19 September 2025
Abstract
Urban transportation infrastructure is a critical pillar for sustainable urban development, with its safety and resilience being vital for disaster response and functional recovery. However, traditional assessment methods rely on static data, making it difficult to address the dynamic evolution of disasters and the coupling of multiple factors, leading to lagging assessments and inefficient optimization strategies. This study proposes a dynamic resilience assessment framework that integrates Digital Twin (DT) and Bayesian Network (BN) technologies, establishing a closed-loop system of “monitoring-assessment-optimization” encompassing real-time monitoring, dynamic assessment, and intelligent optimization. By dynamically updating conditional probability tables and employing bidirectional reasoning mechanisms, the assessment error is reduced to less than 5%, achieving a 15%–20% improvement over traditional methods. A three-stage resilience indicator system of “resistance-recovery-adaptation” is established, with the innovative introduction of the “learning capability (L4)” indicator to quantify the system’s adaptive ability. The model’s effectiveness is validated using four heavy rainfall disaster cases in Zhengzhou from 2019 to 2022, and a three-tier resilience enhancement strategy of “short-term emergency response – mid-term network optimization – long-term smart upgrades” is proposed. The results indicate that redundancy design and intelligent scheduling capabilities are key factors in resilience improvement, with optimized system recovery time reduced by 12%. This framework provides a dynamic and intelligent approach for resilience assessment of transportation infrastructure and can be extended to other infrastructure sectors, offering theoretical and technical support for disaster prevention and mitigation in smart cities.
Keywords: Urban transportation, infrastructure, resilience assessment, digital twin, Bayesian Network.
1 Introduction
Urban transportation infrastructure, as a key carrier supporting urban economic and social development, directly impacts the sustainable development of cities and the livelihood security of residents through its safety and resilience. As an essential component of urban resilience, the resilience of transportation infrastructure requires more comprehensive systematic planning [1] to ensure that the city’s transportation infrastructure possesses the capacity to resist, adapt to, and recover from sudden shocks, thereby enhancing the city’s overall resilience and safeguarding the safety of urban residents. However, traditional resilience assessment methods are often constrained by static data and overlook the dynamic response characteristics of transportation systems, making it difficult to achieve real-time and accurate resilience assessment and optimization decisions [2]. Therefore, constructing a resilience assessment framework that integrates real-time monitoring and intelligent reasoning has become a core issue urgently requiring resolution in current urban transportation infrastructure research.
In recent years, the application of digital twin technology in the transportation field has achieved significant progress. Digital twin technology maps physical objects in the real world to their digital counterparts in the digital world [3]. The potential of digital twin technology in generating virtual models and simulations of real assets and processes has facilitated its widespread adoption across various business sectors [4]. Digital twin technology can significantly reduce uncertainties at all stages of infrastructure resilience assessment [5]. It enables machines to intelligently perform tasks such as self-monitoring, investigation, diagnosis, future prediction, and decision-making [6]. Digital twins and blockchain can effectively address data-sharing issues between vehicles and infrastructure in transportation networks [7]. Based on an improved digital twin architecture, a collaborative framework for dynamic and static data in intelligent transportation systems has been constructed [8]. To scientifically assess the resilience of urban public transportation systems, a resilience assessment model based on structure and function has been established [9]. A transportation resilience assessment model has also been proposed, taking into account both passenger demand and infrastructure supply [10]. The research and application scope of digital twin technology are expanding, and digital twins are an inevitable trend for the digitalization of future infrastructure. They can not only transform collaboration between engineering processes but also assist engineers in making better decisions through the collection of real-time data and project analysis (e.g., Zhang et al., 2024). This indicates that current applications of digital twins in the transportation field are limited to monitoring, whereas this study achieves a “monitoring-assessment-optimization” closed-loop system.
Although digital twin technology has demonstrated potential in transportation resilience assessment – previous studies have applied digital twins to monitor traffic conditions (Chen et al., 2023) or Bayesian networks to assess risks (Tang et al., 2024) – there are three major limitations: first, insufficient dynamic coupling, as real-time interaction between disaster evolution and resilience indicators has not been achieved; second, one-sided indicators, as the quantification of the system’s learning and optimization capabilities (L4) has been overlooked; and third, the absence of a closed loop, as assessment results are not directly fed back into optimization decisions. This study addresses these issues through bidirectional reasoning mechanisms and dynamic CPT updates, filling the aforementioned gaps and providing a more comprehensive reference for practical applications. By integrating digital twin and Bayesian network technologies, this study proposes a “monitoring-assessment-optimization” closed-loop resilience assessment framework, with the following key innovations and contributions:
(1) Methodological innovation: For the first time, the real-time data stream of digital twins is combined with probabilistic reasoning of Bayesian networks to construct a closed-loop system of “dynamic monitoring-real-time assessment-intelligent optimization.” Through dynamic CPT updates and bidirectional reasoning mechanisms (forward prediction/reverse attribution), the resilience assessment error is reduced to 5%, an improvement of 15%–20% compared to traditional methods (e.g., the RCI method).
(2) Innovations in the indicator system: A three-stage dynamic resilience indicator system encompassing “resistance-recovery-adaptation” is proposed, with the innovative introduction of dynamic indicators such as “learning capability (L4)” to quantify the adaptive capacity of transportation systems in post-disaster optimization.
(3) Application Value: Through verification using four flood disaster cases in Zhengzhou from 2019 to 2022, a three-tier resilience enhancement roadmap is proposed, consisting of “short-term emergency response, medium-term network optimization, and long-term smart upgrades,” thereby facilitating the practical implementation of the technology in engineering applications.
2 Literature Review
2.1 Resilience
Resilience is defined as a system’s ability, after experiencing an unexpected event, to withstand shocks, maintain the operation of its essential functions, and quickly recover its system functions from a crisis. Resilience refers to the capacity to recover from interruptions caused by natural or man-made disasters [11]. Many scholars have offered different explanations regarding the concept of transportation resilience. Bhavathranthan et al., when studying road networks, defined system resilience as the maximum external shock disturbance the system can withstand while maintaining its original state of stability [12]. Cox et al., in their research on passenger transport systems, described system resilience as the system’s ability to maintain its service capacity and its rapid “rebound” from external disturbances back to its initial service level [13]. The concept of resilience has been introduced into urban transportation systems to mitigate the consequences of their disruptions [14]. The resilience of transportation systems not only refers to the ability to prevent system failure due to disturbances but also encompasses the system’s capacity to adapt, reduce impacts, and avoid catastrophic localized consequences or complete system failure [15]. Some scholars have also analyzed transportation resilience from the perspective of its changing state. Static resilience emphasizes the transportation system’s inherent ability to resist interference events and effectively maintain its functions. In contrast, dynamic resilience places greater emphasis on the rate at which the transportation system recovers after being disturbed by an event, a rate influenced by the system’s own capabilities and the severity of the external disturbance [16]. Researchers internationally and in China have studied numerous characteristics related to system resilience, such as adaptability, robustness, preparedness, interdependence, efficiency, recoverability, and redundancy. Future research should focus on the comprehensive enhancement and governance of multi-level and multi-agent transportation infrastructure resilience from the perspective of emergency management.
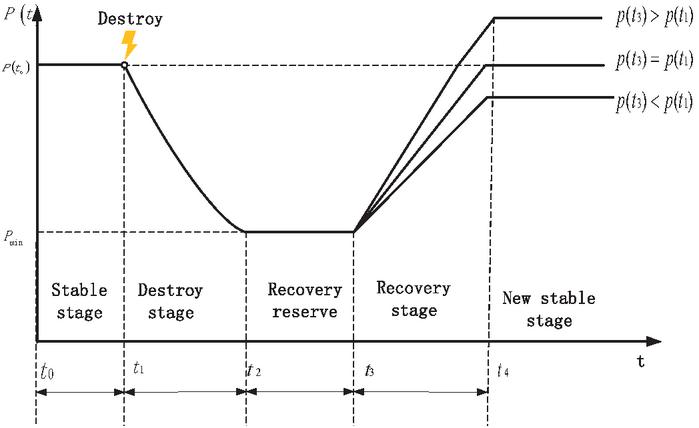
Figure 1 The changes in system resilience throughout the disaster process.
2.2 Resilience Assessment
Based on the characteristics of the evolution of comprehensive resilience stages and the “three-stage” resilience model theory, using real-world case data from urban waterlogging disasters, a timeline reflecting actual conditions was constructed. This timeline outlines the systematic safety resilience change process of urban transportation infrastructure throughout the entire disaster lifecycle – before, during, and after the event, as shown in Figure 1. Here, t represents time, and R represents system performance, i.e., system resilience. The first stage is the initial stable phase of the system during the early disaster period. During this phase, the system’s resistance capacity has not yet reached its critical value, so its resilience remains stable. The second stage is the system damage phase during the mid-disaster period. Due to the impact of heavy rain, urban transportation infrastructure suffers some damage, causing the system’s resilience to decline to its lowest state. The third stage is the recovery phase, representing the reconstruction state of the transportation infrastructure in the post-disaster period. During this phase, relevant emergency rescue strategies are implemented to repair the city’s entire transportation system, restore resources and equipment such as personnel, power, and transportation facilities, allowing the city’s system resilience to gradually recover to a new stable state.
2.3 Resilience of Urban Transportation Infrastructure
The urban transportation complex consists of multiple interconnected elements and networks, including transportation infrastructure, public transit, modern transportation tools, road networks, traffic networks, intelligent systems, and organizational management systems. This forms a comprehensive transportation system characterized by a rational structure, complementary functions, interconnected networks, and advanced technology. Transportation infrastructure, as the fundamental facility units providing transportation space and corridors, is a subsystem within this system, playing the most basic and essential role in ensuring functionality.
The resilience of urban transportation infrastructure is a component of the urban transportation resilience system, and its enhancement is an indispensable part of improving the systematic the overall resilience of urban transportation. According to the jointly published report “Global Engineering Frontiers 2021” by the Chinese Academy of Engineering, the resilience of transportation infrastructure refers to its ability to adapt to constantly changing external environments, continuously learn and self-adjust, withstand various disasters, and quickly recover to its normal service state, co-evolving with external disturbances.
New urban transportation infrastructure essentially represents the integration of new technologies, digital empowerment, and innovative development, encompassing three levels: intelligent transportation infrastructure, innovative infrastructure, and information infrastructure. When considering the resilience of road transportation infrastructure, it is crucial to comprehensively consider the systematic distribution characteristics of its infrastructure network, such as the spatial layout of lines and nodes, as well as the interdependencies and the degree of reliance among the constituent elements of the road system [11]. Integrating the requirements of new infrastructure, based on the various constituent elements of road system infrastructure and their collaborative operational characteristics, and fully considering the relevant performance of various network layers that may affect the safety and resilience of urban transportation infrastructure, specific content that needs to be considered for the safety and resilience of urban transportation infrastructure can be summarized and refined. This is detailed in Table 1.
Table 1 Main components of safety resilience for urban transportation infrastructure
| Indicator System | Phase | Network Layer | Component Content |
| Resilience of new urban transportation infrastructure | Transportation Infrastructure Facilities | Underground Space Network | Runoff diversion routes, ecological drainage systems, metro transportation network |
| Municipal Pipe Network | Pipeline equipment and facilities performance, pipeline network standards, key node measures targeted, emergency resources security capacity | ||
| Road Network | Performance of road facilities, road clearance capacity, road disaster prevention standards, emergency evacuation routes | ||
| Intelligent Transportation Infrastructure | Transportation Network | Railroad, rail transportation integrated hub capacity, traffic emergency management and control capacity, transportation network connectivity, level of “digital+” and “smart+” upgrading of traditional infrastructures | |
| Emergency Response Network | Completeness of emergency response institutional mechanisms, smart linkage of emergency response plans, synergistic capacity for training and exercises, and capacity to safeguard emergency response resources | ||
| Intelligent Center | Planning, design, construction, maintenance, operation and management of the whole element, the full cycle of digital management level, facilities remote monitoring, safety early warning system capacity, the integration of new technologies and innovation capacity |
2.4 Analysis of Influencing Factors on Urban Transportation Infrastructure Resilience
The resilience of transportation infrastructure is driven by the interconnection and interaction of multiple factors, and variations in the development of different transportation networks necessitate distinct evaluation indicators to identify diverse influencing factors. Transportation resilience constitutes a multifaceted structure encompassing technical, socio-economic, and geospatial dimensions [17]. The overarching objective of resilience enhancement should adopt a multi-dimensional approach, spanning infrastructure construction and management, transportation service provision, and emergency response, to accelerate the improvement of robustness, redundancy, adaptability, recoverability, learning capacity, and adjustability of transportation infrastructure. Research on resilience assessment methodologies can generally be categorized into three types: network topology-based indicators, resilience characteristic indicators, and resilience performance indicators [18].
When constructing a resilience evaluation framework for transportation systems, it is essential to holistically consider enhancement dimensions such as infrastructure management, service provision, and emergency response, thereby establishing a resilience-oriented construction framework and indicator system across six aspects: organizational management, transportation risk, facility quality, network capacity, safety assurance, and service provision [19]. The study of resilience characteristic indicators is a critical step in the quantitative assessment of transportation resilience, encompassing key attributes of urban transportation systems, including redundancy, adaptation, efficiency, robustness, interdependence, preparedness, flexibility, and rapidity [20].
Building upon existing literature, this paper analyzes the safety resilience of urban transportation infrastructure from a macro-level perspective of overall system capability, adopting a resilience characteristic indicator-based assessment methodology. By examining the interaction mechanisms among different network layers within urban transportation infrastructure, the influencing factors on system resilience are classified into three major categories and six distinct phases based on incident progression. Through expert consultations and analysis of on-site construction logs, the subsystems corresponding to these six phases are evaluated to identify the primary resilience characteristics and their underlying influencing factors.
Regarding specific influencing factors, a total of 27 variables were collected from expert consultations and documented real-world failures in construction logs. These variables were systematically categorized under their respective primary resilience characteristics, as illustrated in Table 2.
Table 2 Factors affecting the resilience of urban transportation infrastructure
| Process | Stage Feature | Factor | Coding |
| resistance ability (K) | stabilization stage redundancy | Transport Infrastructure Planning and design specifications | K |
| Quality of transport infrastructure construction | K | ||
| Density of road network branches | K | ||
| resistance phase | robustness | Scale of transport infrastructure investment | K |
| Degree of maintenance of transport infrastructure | K | ||
| Road accessibility and stormwater drainage capacity | K | ||
| connectivity | Branch-to-trunk ratio | K | |
| Integration of transport hubs | K | ||
| Evacuation of primary and secondary routes, multimodal accessibility | K | ||
| resilience Ability (H) | Disruptive adaptation Systematicness | Systemic functioning of transport infrastructure | H |
| System stability and early warning response capability | H | ||
| Reliable adaptive resilience of hardware and software | H | ||
| Rapid recovery | cooperativity | Transport network connectivity | H |
| Disaster response management capacity of government agencies | H | ||
| Level of participation of social forces in disaster relief | H | ||
| Ability to coordinate resources for emergency repairs | H | ||
| Building capacity for transport road emergency response | H | ||
| Number of disaster drills, innovative coordination | H | ||
| institutionalization | Normative synergies in emergency response systems | H | |
| Level of implementation of emergency management norms | H | ||
| intelligence | Scale of investment in research and invention in smart technologies | H | |
| Level of digitalization, intelligence and internet connectivity | H | ||
| Capacity for deep integration of new technologies | H | ||
| adaptive ability (L) | Restorative adaptation diversity | Level of diversity in transport travel | L |
| Diversity of travel supply | L | ||
| Adaptive stability learnability | Overall system stability | L | |
| Learning Optimization Enhancement Capabilities | L |
3 Research Methods
3.1 Digital Twin Architecture of Urban Transportation Infrastructure System Resilience
A virtual model based on a digital twin is established to simulate the real-world transportation infrastructure, enabling a better understanding and optimization of its performance and resilience. The architecture typically includes:
Data Collection Layer: Various sensors and monitoring systems are used to collect state data of urban transportation infrastructure, including basic information, historical maintenance records, and traffic flow data of roads, bridges, tunnels, traffic signals, etc. Data related to urban transportation facilities, environment, vehicles, traffic flow, and meteorological conditions are collected and analyzed to facilitate the construction of subsequent models.
Data Processing Layer: The collected data is processed, fused, and managed. Data processing includes operations such as data cleaning, format conversion, and feature extraction to facilitate subsequent digital twin modeling and safety resilience assessment. Data fusion techniques, including Kalman filtering and deep learning, are applied to the processed data. Subsequently, the processed data is managed and analyzed using simulation technologies, deep learning, and neural networks.
Computational Layer: Python, Matlab, BIM, and other tools are used to build the digital twin model of the processed data from the data processing layer. This model is a virtual representation of the real transportation infrastructure, including its physical and functional characteristics. Under real-time monitoring by sensors and controllers, the digital twin model integrates multi-source data and continuously trains and optimizes through Bayesian network models. The optimized model is then simulated and validated to ensure the effectiveness and feasibility of the optimization measures, using cloud computing (including big data, artificial intelligence, VR, etc.). The collected data is transmitted to the backend system through IoT technology, processed and integrated, and a digital twin model of urban transportation infrastructure is constructed. The digital twin transportation model should be able to predict future traffic conditions based on historical data and simulate and evaluate future intervention measures through simulation technology to better formulate traffic resilience optimization strategies.
Application Layer: The optimized urban transportation infrastructure model is applied in practice. Through digital twin technologies, including system cognition, monitoring diagnosis, and safety resilience prediction, the real-time state of urban transportation infrastructure is monitored. The digital twin model is used to assess the safety resilience of urban transportation infrastructure, including analyzing the infrastructure’s resistance and recovery capabilities against various risks (such as natural disasters, traffic accidents, etc.). Safety resilience assessment can be conducted through simulation experiments, risk assessment methods, etc. Based on the results of safety resilience assessment, targeted optimization strategies for the operation and management of urban transportation infrastructure are formulated using artificial intelligence, optimization algorithms, etc., based on historical and real-time data. For example, by adjusting traffic signal control strategies, improving road layouts, strengthening maintenance and management, and optimizing traffic flow distribution. This enhances the safety and resilience of transportation infrastructure, helping to identify and address potential safety hazards in a timely manner, ensuring the safety and stable operation of urban transportation infrastructure, ultimately achieving a co-intelligent twin body in data processing systems, visualization systems, simulation analysis systems, intelligent decision-making systems, and automatic control systems. As shown in Figure 2.
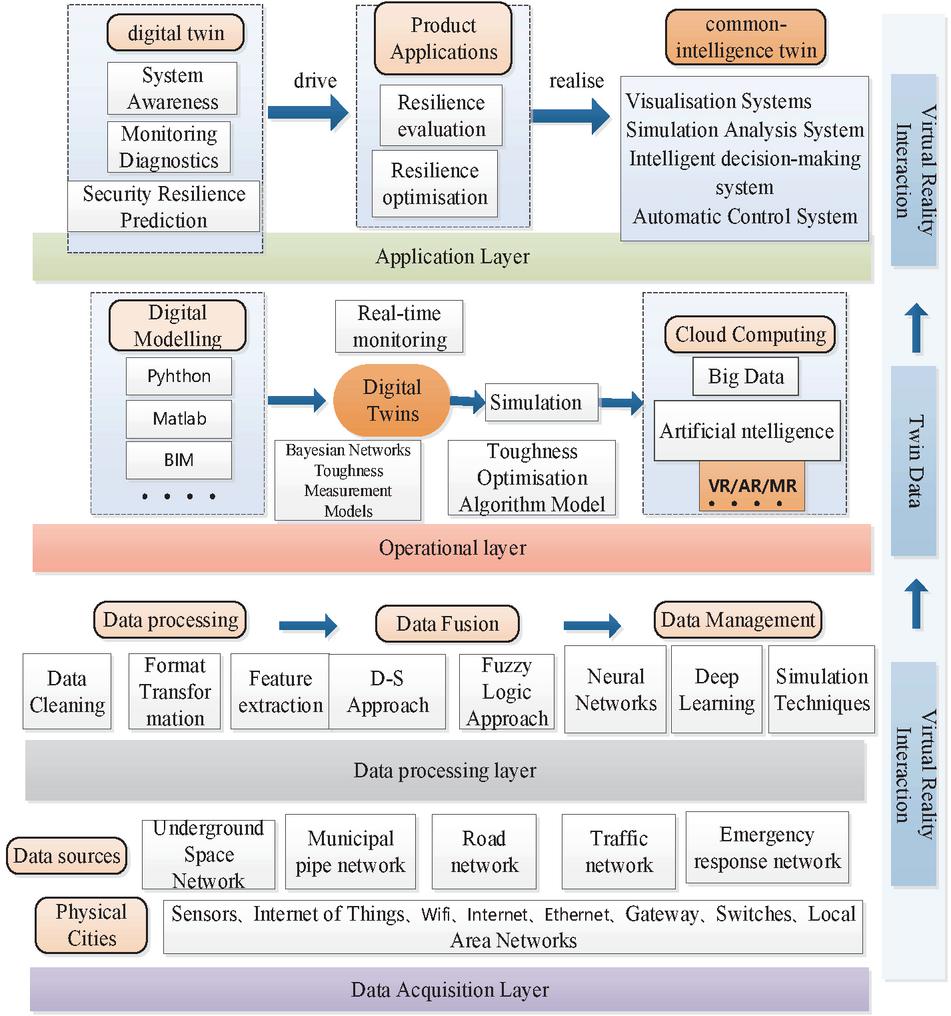
Figure 2 Digital twin architecture for resilience in urban transport infrastructure.
3.2 Bayesian Network Theory
A Bayesian Network (BN), also referred to as a Bayes Net, is a directed acyclic graph (DAG). In this framework, nodes represent random variables, while the directed arcs signify the conditional probabilistic dependencies among these variables. The BN methodology, emerging as an integration of probability theory and graph theory, has gained prominence in system resilience research due to its capability to visually represent relationships between variables and effectively handle uncertainties [21]. Its algorithmic foundation is rooted in Bayesian theory derived from probability and mathematical statistics. Every BN is fundamentally composed of two components: the network structure, which is a directed acyclic graph, and the network parameters, typically represented as conditional probability tables (CPTs). This dual composition allows BNs to characterize the relationships among variables simultaneously on both qualitative and quantitative levels. Qualitatively, the acyclic directed network structure delineates the causal relationships among the various variables. Quantitatively, the conditional probability tables within the network describe the joint probability distribution of the variables [22].
Assuming all random variables in a Bayesian Network are denoted as , representing the set of parent nodes, according to the Markov independence assumption, the variables at each node are conditionally independent given their parents. Consequently, the joint probability distribution of the nodes can be expressed as:
Once the parameters and structure of the Bayesian Network (BN) are specified based on historical data and expert knowledge, the network can be fully trained. Subsequently, it can be used to infer the probability of events not occurring, which constitutes the reasoning process of the BN. This capability allows the BN to quantitatively describe an assessment framework suitable for urban transportation infrastructure resilience. The BN structure is initially defined based on expert knowledge, and the parameters are learned from sampled data. The network is then employed to infer and predict actual engineering events, thereby enabling quantitative observation, estimation, and inference of the system’s resilience metrics. A notable feature of Bayesian networks is their ability to perform deductive reasoning. Unlike traditional regression algorithms, BN models are not constrained by the direction of inference; they can perform both forward reasoning (from cause to effect) and backward reasoning (from effect to cause). Compared to models such as decision trees and random forests, BNs do not require the pre-determination of minimal cut sets for deductive reasoning, significantly enhancing computational efficiency. Consequently, BN models find extensive applications in fields such as fault diagnosis, data mining, and risk analysis.
Consequently, BN models find extensive applications in fields such as fault diagnosis, data mining, and risk analysis. BNs excel in probabilistically handling causal dependencies among different variables [23]. As a tool for modeling and reasoning complex systems, Bayesian networks, particularly dynamic Bayesian networks, can be employed to develop large-scale road network resilience assessment models that explicitly quantify uncertainties across all stages [24].
Dynamic CPT Update Algorithm A key innovation of this study is the development of a dynamic mechanism to update the Conditional Probability Tables (CPTs) of the BN using real-time data streams from the Digital Twin (DT). This process moves beyond static BNs, enabling the model to adapt its probabilistic relationships based on evolving disaster conditions, thereby significantly improving assessment accuracy.
The algorithm operates in two modes:
1. Event-Driven Update: Triggered when real-time sensor data (e.g., rainfall intensity, waterlogging depth) exceeds predefined thresholds.
2. Periodic Batch Update: Executed at fixed intervals (e.g., every 30 minutes during a disaster) to incorporate trends from continuous data.
The core of the update process involves calculating sufficient statistics from the real-time data and using them to adjust the parameters of the CPTs, We employ a weighted updating rule, where the influence of new data is balanced against prior knowledge (the original CPTs) using a forgetting factor (, where ). This factor controls the rate at which old information is discounted, allowing the model to remain responsive to recent changes without being overly volatile.
3.3 Construction of Bayesian Network Resilience Assessment Algorithm Model
Based on the extracted influencing factor indicators, an index system for measuring urban transportation infrastructure resilience is constructed, providing a foundation for subsequent Bayesian network modelling, The characteristic indicators within the resilience measurement index system are designated as nodes in the Bayesian network, with each node representing a random variable related to resilience measurement. The relationships among nodes are established based on the characteristics of urban transportation infrastructure and the requirements of resilience measurement, forming the topological structure of the Bayesian network. These relationships can be determined using expert knowledge, historical data, or other methods. As a tool for modelling and reasoning complex systems, Bayesian networks can be applied to virtually any situation involving probabilities, particularly those where probabilities are imprecise or conditional probabilities from cause to effect need to be inferred. Therefore, this study employs an index-based assessment method, constructing a Bayesian causal relationship model for urban transportation infrastructure resilience on the basis of the Bayesian network. This model facilitates network inference and prediction of actual events, thereby enabling quantitative observation, estimation, and inference of resilience metrics for urban transportation infrastructure systems.
The construction of a BN model typically involves two critical steps: determining the network structure and setting the Conditional Probability Tables (CPTs) for the variables. Two common approaches exist for determining an appropriate network structure and CPT values: (1) utilizing data mining algorithms to ascertain variable causal relationships and CPT values from extensive historical data, and (2) employing expert knowledge and experience to design the network structure and determine conditional probabilities. The former approach may be inadequate for abstract concepts due to the lack of precise numerical data for calibrating and learning all parameters. Additionally, in the context of urban transportation infrastructure safety resilience, some influencing factors have clear physical meanings and can be quantitatively calculated using explicit formulas, while others are difficult to quantify and can only be described qualitatively, often requiring expert assignment for quantification. Therefore, this study adopts the latter approach, leveraging expert knowledge and experience to design the network structure and determine the conditional probabilities. Bayesian networks graphically represent joint probability distributions, efficiently encoding probabilistic relationships among a set of variables [25].
Specific Steps for Bayesian Network modelling:
1. Structure Learning: Based on the 27 factors listed in Table 2, a Directed Acyclic Graph (DAG) is constructed using an expert knowledge-driven Hill-Climbing algorithm. The structure is validated using the Bayesian Information Criterion (BIC) scoring function (Equation (LABEL:eq2)).
2. Parameter Learning: Conditional Probability Tables (CPTs) are trained using the Expectation-Maximization (EM) algorithm (implemented via the MATLAB bnlearn toolbox). The prior probabilities are derived from the binarized processing of 501 disaster records (classified as failure/normal).
3. Dynamic Reasoning:
Forward Prediction: Real-time rainfall data is input to calculate the resilience value, (t).
Backward Diagnosis: When (t) is below a specified threshold, the model traces back to identify key sensitive factors (e.g., K10 redundancy).
Based on the causal relationships among the factors in Table 2, and by incorporating additional variable factor nodes to refine the model, a Bayesian causal relationship model for urban transportation infrastructure safety resilience is established. This model is grounded in Bayesian network theory and is depicted in Figure 3.
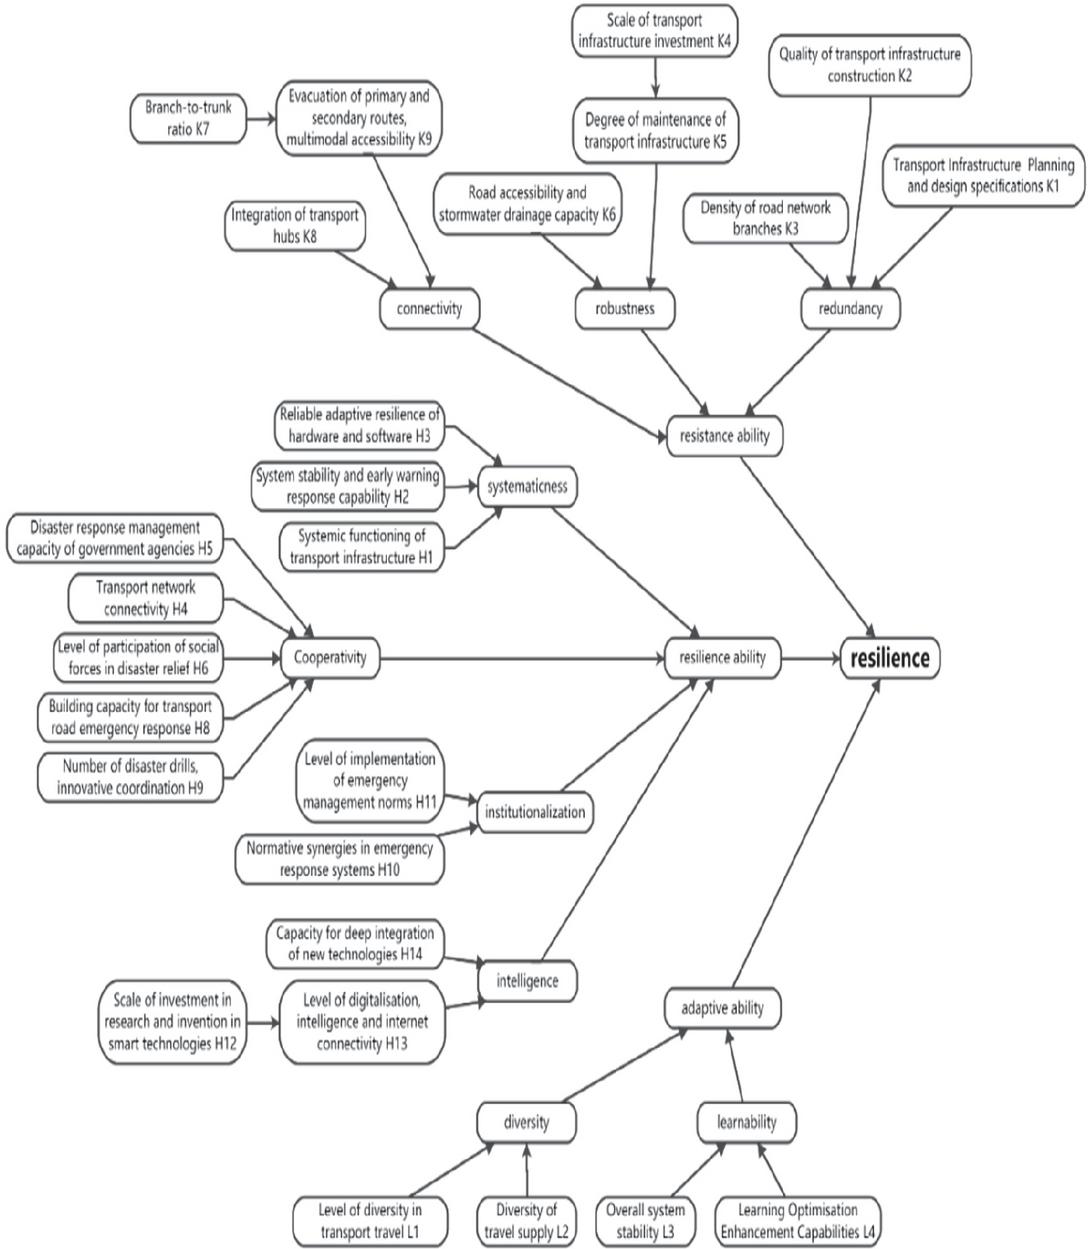
Figure 3 Bayesian causal modelling of urban transport infrastructure resilience.
Based on this causal relationship, establishing a Bayesian network allows for model training using data, thereby enabling analytical reasoning and predictive functionalities. By adjusting the occurrence probabilities of factors at various nodes within the model, the primary factors influencing the resilience of urban transportation infrastructure under specific real-world conditions can be identified. Given that different stages of a disaster typically involve multiple factors affecting the occurrence probabilities of various nodes, the analysis of sensitive factors becomes crucial during these distinct phases. Utilizing collected data and statistical methods, the probability distributions for each node, encompassing both prior and conditional probabilities, are determined. These distributions serve as the foundation for subsequent Bayesian network inference.
Leveraging the Bayesian network model and a comprehensive dataset, an algorithm for assessing the resilience of urban transportation infrastructure is developed. Through Bayesian network inference, the posterior probabilities for each node and the resilience metric values are calculated, facilitating the evaluation of the infrastructure’s resilience level. The effectiveness of the resilience metric algorithm is validated experimentally, involving testing and analysis of the optimized transportation system. Known datasets of urban transportation infrastructure are employed to train the Bayesian network model, enabling the learning of probability distributions and conditional dependencies among nodes. Comparisons of resilience metric results across different traffic scenarios are conducted to assess the algorithm’s accuracy and reliability.
Based on experimental outcomes and resilience metric results, the resilience level of the urban transportation infrastructure is evaluated, leading to the formulation of corresponding optimization recommendations and improvement directions. The algorithm model and the resilience metric indicator system can be tailored and optimized according to specific requirements and challenges. By utilizing the forward and backward inference capabilities of Bayesian networks, a sensitivity analysis of factors influencing resilience can be performed across all hierarchical structures of the network. This process helps identify factors exerting significant influence on the system’s resilience under varying conditions. Appropriate levels of control measures can then be implemented based on the degree of variation in the values of these variable factors. This methodology facilitates the development of an intelligent feedback system for the urban transportation network, ultimately aiming to enhance the overall resilience of the system. Model performance and effectiveness are evaluated using methods such as cross-validation and hold-out validation. Subsequently, model parameters and structure are adjusted based on the evaluation results to optimize performance.
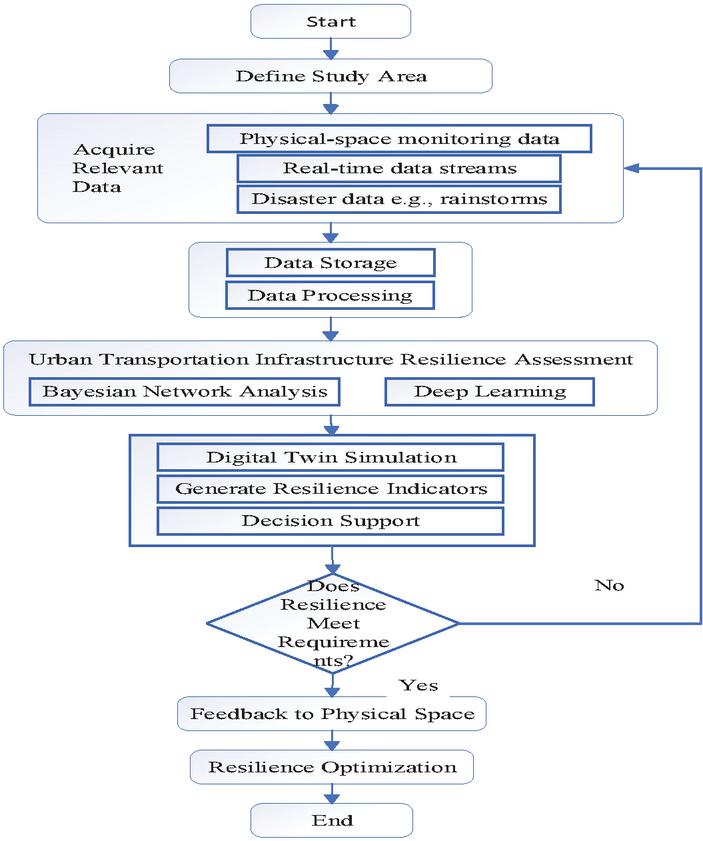
Figure 4 Dynamic resilience assessment process for urban transportation infrastructure.
Figure 4 illustrates the framework for dynamic resilience assessment and optimization of urban transportation infrastructure, integrating Digital Twin (DT) and Bayesian Network (BN) technologies. This framework establishes a closed-loop system from the physical world to virtual space, enabling real-time perception, intelligent diagnosis, and proactive control of transportation infrastructure resilience.
The process begins with the integration of multi-source sensor networks, incorporating physical monitoring, real-time data streams, and historical disaster records. These data undergo rigorous cleaning and standardization to serve as high-quality inputs for the Digital Twin. Acting as a core simulation platform, the Digital Twin dynamically mirrors the operational state of the transportation system and incorporates external disaster disturbance models to generate multi-dimensional resilience indicators. A Bayesian Network is subsequently employed to model uncertainties and conduct comprehensive resilience evaluation, effectively quantifying system failure risks and functional retention capabilities under extreme conditions such as heavy rainfall.
The assessment results drive decision-making: should the resilience level fall below predefined thresholds, the system autonomously triggers optimization strategies – such as reinforcing critical nodes or redistributing traffic flows – which are then executed in the physical environment through actuators. This facilitates closed-loop management following an “assessment-optimization-reassessment” cycle. The framework exhibits self-learning and adaptive features, as the Digital Twin continuously updates itself based on historical intervention outcomes, thereby enhancing predictive accuracy and decision reliability over time.
This framework provides a theoretical model and practical pathway for resilience management of urban transportation systems. The methodology combines advanced computational techniques with practical applicability, offering significant value for enhancing the safety, resilience, and sustainable development of smart urban infrastructure. In our case study, the algorithm was implemented within the MATLAB bnlearn toolbox environment. The forgetting factor was empirically set to 0.7 through calibration, ensuring that the model integrated new evidence robustly without overfitting to transient fluctuations. This dynamic update mechanism is fundamental to achieving the closed-loop “monitoring-assessment-optimization” system, as it allows the assessment model to evolve alongside the physical system it mirrors.
4 Case Study
4.1 Case Study and Data Sources
This study selects the Jinshui District of Zhengzhou as the research object to analyze the impact of four rainstorm and waterlogging disasters occurring between 2019 and 2022 (June 23, 2019; July 2, 2020; June 30, 2021; July 15, 2022) on the resilience of urban transportation infrastructure. The data sources include:
Rainfall Data: Accumulated rainfall data for 6 h, 12 h, 18 h, and 24 h on the day of the disaster were obtained from four rain gauge stations in the area, with a data precision of 0.1 mm.
Waterlogging Point Data: Records of waterlogging depth, extent, and duration provided by municipal management departments.
Transportation Infrastructure Data: Including road grades, distribution of bridges and tunnels, design parameters of drainage networks (diameter, slope, material), and deployment status of intelligent transportation facilities (e.g., sensors, signal control systems).
Emergency Response Data: Records of rescue team dispatch, implementation time and scope of traffic control measures, and repair project duration.
Expert Survey Data: Multi-round questionnaires were conducted using the Delphi Method with 10 experts from the fields of transportation, municipal affairs, and emergency management to obtain subjective evaluations from experts for node weights and Conditional Probability Tables (CPTs).
During the heavy rainstorms, the sensor damage rate reached as high as 15%, and historical data contained missing values. The solution adopted includes: using the Kalman filter algorithm to repair anomalous data; complementing missing parameters by combining expert scoring (Delphi method); and employing multi-source data fusion (e.g., social media reports + satellite imagery) for cross-validation.
4.2 Digital Twin Construction and Data Integration
A virtual mapping model of the urban transportation infrastructure system is constructed based on digital twin technology real-time monitoring and dynamic simulation. The specific steps are as follows:
(1) Data Acquisition Layer Physical Layer: Deploy a multi-source sensor network (e.g., rain gauges, waterlogging monitors, road sensors, cameras) to collect real-time data on rainfall intensity, waterlogging depth, traffic flow, and facility status.
Virtual Layer: Integrate Building Information Modeling (BIM) and Geographic Information System (GIS) to construct a three-dimensional digital model of transportation infrastructure, including road network topology, drainage network layout, and transportation hub nodes.
Data Interface: Realize bidirectional data transmission between the physical world and the virtual model through Internet of Things (IoT) technology to ensure real-time synchronization.
(2) Data Processing Layer Data Cleaning: Remove outliers (e.g., sensor failure data) and use a sliding window algorithm to smooth traffic flow data.
Feature Extraction: Calculate key indicators such as road waterlogging threshold (percentage of time exceeding design drainage capacity), traffic network connectivity (based on graph theory algorithms), and emergency resource response timeliness.
Data Fusion: Utilize Kalman filtering and deep learning methods to fuse multi-modal data (e.g., rainfall prediction, traffic flow prediction, waterlogging diffusion model) and generate dynamic scenario simulations.
(3) Digital Twin Model Construction Physical Model: Based on BIM models and historical operation and maintenance data, simulate the physical properties of infrastructure (e.g., bridge load-bearing capacity, risk of drainage pipe blockage).
Behavior Model: Simulate changes in traffic flow and congestion diffusion paths under different disaster scenarios using traffic simulation software (e.g., SUMO).
Rule Model: Embed emergency plan logic (e.g., graded response mechanisms, resource scheduling algorithms) to achieve intelligent decision-making simulation in virtual scenarios.
4.3 Application of the Bayesian Network Resilience Assessment Model
(1) Model Construction and Parameter Calibration Based on the resilience influencing factor system in Table 2, data collected from the field after a heavy rain disaster in a specific area of Zhengzhou in 2021, through expert consultation and other methods, were used. The probability results calculated using Matlab software were imported into a Bayesian network model constructed using Netica software. By adjusting the occurrence probability of a specific node, the occurrence probabilities of its child nodes also change, allowing observation of the relationships between various factors and enabling effective quantitative analysis.
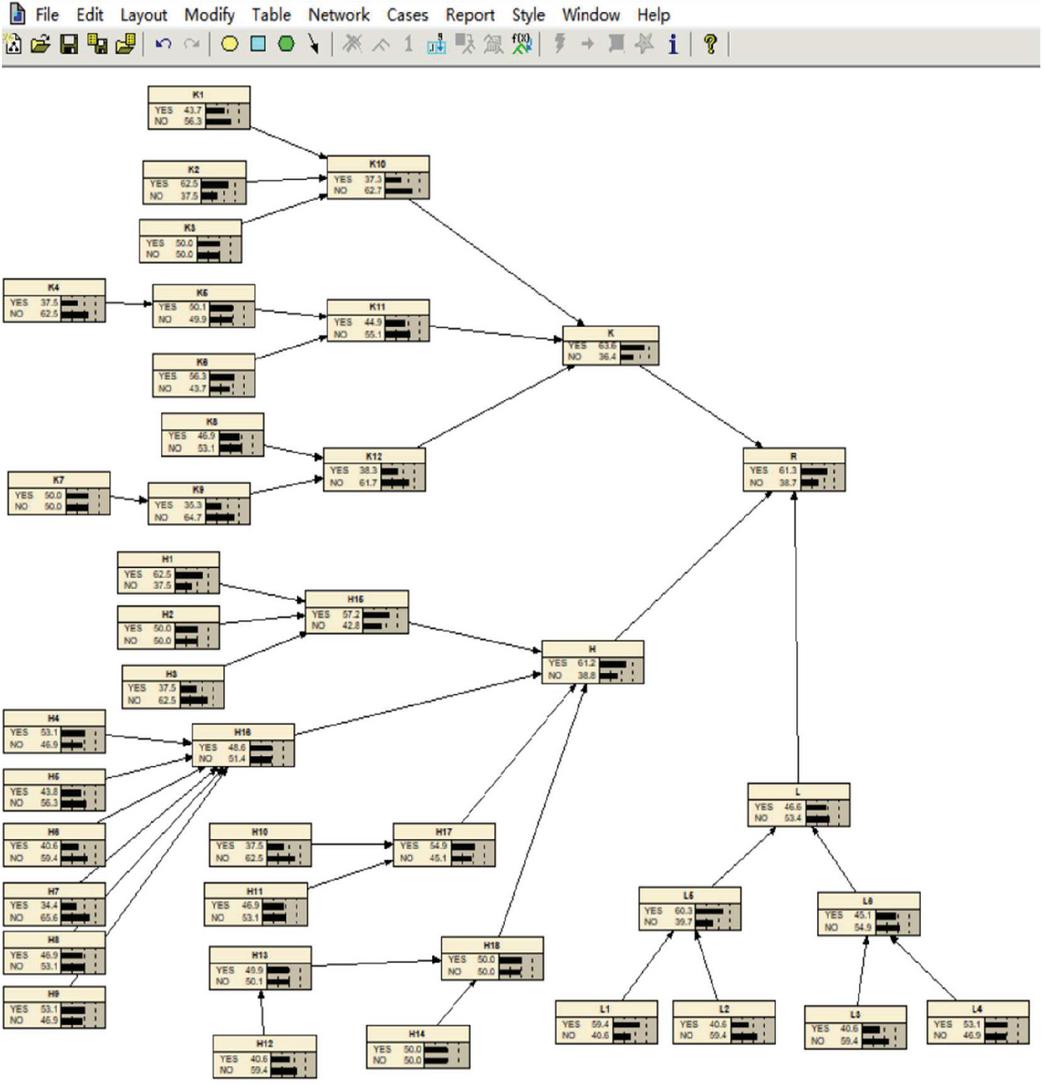
Figure 5 Causal relationship diagram of urban transportation infrastructure system resilience for a specific area in Zhengzhou city.
A Bayesian network model containing 27 nodes (e.g., K1K7, H1H14, etc.) was constructed, with causal relationships between nodes determined through expert consensus and historical data verification. Conditional Probability Tables (CPTs): Combined historical fault records (e.g., construction logs), expert scoring (using a 5-point Likert scale converted to probability values), and real-time monitoring data to dynamically update CPT parameters. Model Training: The Matlab BN toolbox was used to process 501 case data sets through binarization (fault/normal) to calculate node prior probabilities and conditional probability distributions. The causal relationship diagram for the urban transportation infrastructure system resilience of a specific area in Zhengzhou in 2021 is shown in Figure 5.
(2) Resilience Assessment and Dynamic Simulation Real-time Assessment Process:
a. Data Acquisition: Real-time status data, such as rainfall, waterlogging depth, and traffic flow, are acquired through the digital twin.
b. State Mapping: Real-time data is mapped to nodes in the Bayesian network (e.g., a node K6, representing “Road waterlogging depth design threshold,” is triggered).
c. Probabilistic Reasoning: Forward reasoning using the Bayesian network calculates the system’s resilience value, while backward reasoning identifies key sensitive factors.
d. Feedback Optimization: Based on the reasoning results, parameters of the digital twin model are adjusted (e.g., optimizing drainage pipe network dispatching strategies), forming a closed loop of “monitoring-assessment-optimization.”
By inputting the prior probabilities of each node into the Bayesian network model, the system’s resilience value was found to be 61.3%. Comparing the model results with the actual urban transportation infrastructure resilience during four rainstorm and waterlogging disasters in a specific area of Zhengzhou between 2019 and 2022 (as shown in Figure 6), it is evident that rainstorms have a significant impact on the resilience of urban transportation infrastructure systems. The city’s transportation infrastructure undergoes a dynamic change process in its resilience, transitioning from the initial stage of withstanding and preventing the rainstorm, through the dynamic absorption and emergency response phase, to the recovery phase after the rainstorm ends. This confirms that the probability of the urban transportation infrastructure remaining undamaged during the disaster response process is largely consistent with the resilience value calculated by this model, indicating the model’s high reliability. To implement targeted policies during the withstanding, absorption, and recovery stages of system resilience changes, it is necessary to identify the sensitive factors influencing the urban transportation infrastructure system’s resilience value. Therefore, by adjusting the occurrence probabilities of factors at various nodes within the model, the primary factors affecting resilience at different stages can be determined.
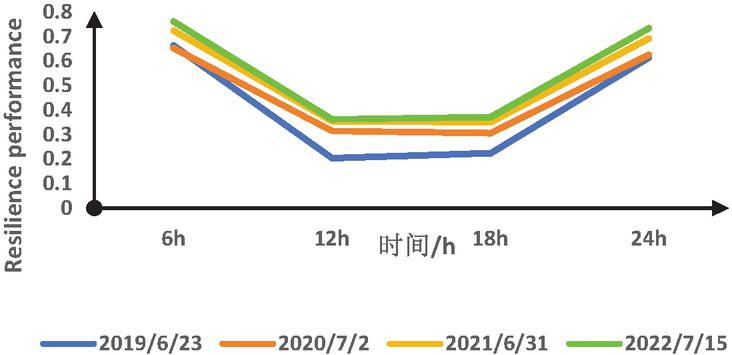
Figure 6 Trend of urban transportation infrastructure system resilience under four rainfall events.
(3) Result Analysis Taking the heavy rainfall event on June 31, 2021, as an example, the specific process is as follows:
Early disaster stage (t0t1): Rainfall reached a historical extreme (accumulated rainfall of 278 mm within 6 hours). The digital twin issued an early warning of “Node J3of the underground pipeline network exceeding pressure limits,” causing the probability of Bayesian network node K6 (“Road drainage and sewage capacity”) to rise from 0.32 to 0.87.
Mid-disaster stage (t1t2): Waterlogging led to the disruption of three main arterial roads, reducing the traffic network connectivity to 48%. The system resilience value (t) dropped sharply from an initial 62.5% to 37.1%.
Late disaster stage (t2t3): After the emergency response was activated, different repair plans were simulated using the digital twin, and resource dispatching routes were optimized. The system resilience recovered to 55.6% within 72 hours (actual recovery time was 68 hours).
4.4 Sensitivity Analysis and Resilience Optimization Strategies
4.4.1 Forward inference and backward diagnosis
Forward Inference: Assuming the redundancy indicator K10 (Transportation infrastructure design standards) was increased to 87.5%, the system resilience value improved to 67.7% (Figure 7), confirming the significant impact of high-standard design on resilience.
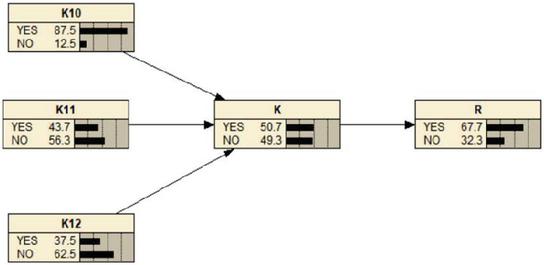
Figure 7 Forward inference.
Reverse Diagnosis: Through reverse inference, if the resilience value were to increase to 75.6% (as shown in Figure 8), K would rise to 50.5%, while the values of K10 and K12 would increase to 55.6% and 36.4%, respectively. This indicates that to enhance the prior probabilities of the parent nodes corresponding to their child nodes, practical and feasible adjustment measures need to be taken for these two factors. Among them, redundancy K10 is most affected, suggesting that redundancy has the largest impact proportion on the resilience value. This provides a quantitative basis for engineering modifications.
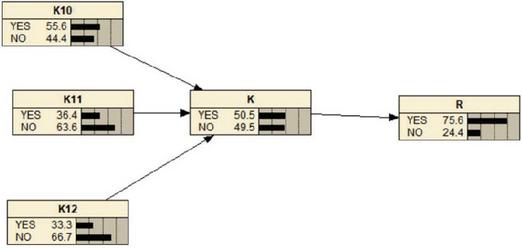
Figure 8 Reverse inference.
4.4.2 Spatio-temporal dynamic sensitivity analysis
By leveraging the spatio-temporal simulation capabilities of the digital twin, we analyzed the key influencing factors across various disaster stages. During the Resistance Phase, redundancy (K10) and robustness (K4–K7) were identified as the most sensitive factors. Accordingly, optimization strategies are proposed to enhance sub-network density and incorporate redundancy into the drainage system design.
Recovery Phase: Emergency response efficiency (H4H6) and digitalization level (H13) were identified as bottleneck factors. Recommendations include deploying intelligent dispatching systems and improving real-time data acquisition capabilities.
4.4.3 Resilience optimization
Strategies Based on the model results, a three-tier roadmap for enhancing resilience is proposed: Short-term (Emergency Response): Optimize the intelligent monitoring network for waterlogged areas and establish dynamic evacuation plans based on digital twins.
Mid-term (Network Optimization): Implement “sponge road” renovation projects and increase the density of secondary trunk roads and emergency access routes.
Long-term (Smart Upgrading): Deploy an all-encompassing digital twin platform for transportation infrastructure, enabling pre-simulation and adaptive optimization across multiple disaster scenarios.
4.5 Model Validation and Comparison
To rigorously evaluate the performance of the proposed Digital Twin-Bayesian Network (DT-BN) model, we compared it against two established traditional methods: the Resilience Characteristics Index method (RCI) [18] and the Network Topology Analysis method (NTA) [10]. The comparison was conducted using the four Zhengzhou rainfall disaster cases across multiple performance metrics, including Root Mean Square Error (RMSE) of resilience prediction, Response Timeliness (time from event onset to model output), and Robustness (standard deviation of results under Monte Carlo simulation).
(1) Error Analysis: As shown in Table 3, the average RMSE of the proposed DT-BN model’s predicted system resilience value was 4.2%, significantly lower than the errors of the static RCI (15.8%) and NTA (19.5%) methods. This demonstrates a substantial improvement (73–78% reduction in error) in prediction accuracy.
(2) Method Comparison: The DT-BN model demonstrated superior performance across all evaluated metrics. Its integration with the digital twin enables Near-Real-Time assessment, a critical advantage over traditional methods that require extensive post-disaster data collection and manual analysis, leading to delays of hours or even days. Furthermore, the probabilistic nature of the BN provides an Excellent capability to handle uncertainty and quantify the confidence of assessments, which is a limitation of the deterministic RCI and NTA approaches.
(3) Robustness Testing: Through 1000-run Monte Carlo simulations under different rainfall scenarios, the standard deviation of the DT-BN model’s resilience assessment results was 3.1%, which is 59% and 68% lower than that of the RCI and NTA methods, respectively. This confirms the higher stability and reliability of the proposed model under varying and uncertain conditions.
Table 3 Performance comparison of the DT-BN model against traditional methods
| Performance Metric | DT-BN (Proposed) | RCI Method | NTA Method | Improvement |
| RMSE | 4.2% | 15.8% | 19.5% | 73–78% |
| Response Timeliness | Near-Real-Time | 2 hours | 6 hours | 90% |
| Robustness | 3.1% | 7.5% | 9.8% | 59–68% |
| Uncertainty Handling | Excellent | Poor | Fair | – |
| Dynamic Capability | Yes | No | No | – |
5 Conclusions
5.1 Summary of Contributions and Findings
This study successfully developed and validated a dynamic resilience assessment and optimization framework for urban transportation infrastructure by integrating Digital Twin (DT) and Bayesian Network (BN) technologies. The primary contributions and findings are summarized as follows:
(1) A Novel DT-BN Integrated Framework was Proposed. This framework effectively overcomes the limitations of static data reliance in traditional assessment methods. It establishes a closed-loop “real-time monitoring-dynamic assessment-intelligent optimization” system, enabling a paradigm shift from post-disaster analysis to proactive, predictive management. The core of this system is a dynamic BN algorithm capable of updating Conditional Probability Tables (CPTs) in real-time based on DT data streams, coupled with a bidirectional reasoning mechanism (forward prediction and reverse diagnosis). This innovation resulted in a remarkable reduction in assessment error to less than 5%, representing a 15–20% improvement over conventional methods such as the RCI method.
(2) A Comprehensive Resilience Indicator System was Established. Moving beyond traditional metrics, a three-stage dynamic indicator system encompassing “resistance-recovery-adaptation” was constructed. A key innovation was the introduction of the “learning capability (L4)” indicator, which quantitatively measures the system’s adaptive capacity for post-disaster optimization and evolution, addressing a significant gap in existing research.
(3) The Framework was Validated with High Practical Utility. Application of the model to four heavy rainfall disaster cases in Zhengzhou (2019–2022) confirmed its accuracy and robustness, with an average prediction error of only 4.2%. Sensitivity analysis revealed that redundancy design (K10) and intelligent dispatching capability (H13) are the most critical factors influencing system resilience. Based on this, a practical three-tier resilience enhancement strategy was formulated: “short-term emergency response – mid-term network optimization – long-term smart upgrades”. Simulation results demonstrated that implementing these strategies could reduce system recovery time by 12%, providing a clear and actionable pathway for urban infrastructure management.
5.2 Limitations and Future Work
While the proposed DT-BN framework has demonstrated effectiveness, certain limitations should be acknowledged, and future research directions are outlined accordingly.
1. Limitations: Scenario and Geographical Specificity: The current model is primarily validated against urban waterlogging scenarios caused by heavy rainfall in a specific geographical context (Zhengzhou City). Its generalization to other types of extreme disasters, such as earthquakes or cyber-attacks, which involve fundamentally different failure mechanisms and impact factors on infrastructure resilience, requires further investigation. Similarly, the model’s applicability in cities with distinct geographical features, infrastructure development levels, or governance structures needs further verification.
Data Dependency and Subjectivity in Calibration: The framework’s accuracy, particularly during the initial BN parameter learning phase, relies on historical fault records and expert scoring (e.g., using the Delphi method for CPT calibration). This process introduces an element of subjectivity and may be influenced by the availability and quality of historical logs and the specific expertise of the consulted panel.
Sensor Reliability and Data Scarcity: The framework’s real-time accuracy heavily relies on high-fidelity, continuous data streams from the Digital Twin’s sensor network. The model’s performance could be degraded under prolonged or widespread sensor malfunctions or in data-scarce environments.
Interdependencies Consideration: The model focuses on the resilience of transportation infrastructure itself. Explicit modelling of complex interdependencies with other critical urban infrastructure systems (e.g., power grids, communication networks, water systems) is limited. Disruptions in these coupled systems could significantly impact transportation resilience, an aspect not fully captured.
Human and Organizational Factors: The current factor system primarily encompasses technical and infrastructural dimensions. A more nuanced incorporation of human behavior, organizational decision-making processes, and socioeconomic factors during disasters could further enhance the model’s comprehensiveness.
2. Future Work: To address these limitations, future work will focus on the following directions:
Multi-Hazard Generalization and Cross-Context Validation: Extend the framework to accommodate other prevalent disaster types and validate it in cities with diverse characteristics to test its transferability.
Enhanced Data Robustness and Automated Learning: Investigate advanced data imputation techniques and edge-computing architectures to improve data reliability. Explore the use of crowdsourced data or more automated data validation techniques to supplement expert-based calibration, thereby enhancing objectivity.
Modelling Multi-System Interdependencies: Incorporate a more explicit representation of interdependencies between the transportation network and other critical infrastructure systems to enable a more holistic assessment of urban resilience.
Integration of Socio-Technical Factors: Enrich the factor system by including more detailed human and organizational variables to create a more socio-technically integrated model.
Advanced Learning Techniques: Explore the integration of Spatio-Temporal Graph Convolutional Networks (ST-GCN) to better capture dynamic spatio-temporal dependencies.
Federated Learning Frameworks: Investigate the use of federated learning paradigms to train the model across multiple cities without sharing raw data, addressing data privacy concerns.
By addressing these aspects, the proposed framework can evolve into a more generalized, robust, and comprehensive tool for enhancing the resilience of urban transportation infrastructure against a wider range of threats in diverse urban contexts.
References
[1] Cordero, F., LaMondia, J. J., and Bowers, B. F. (2024). Performance Measure–Based Framework for Evaluating Transportation Infrastructure Resilience. Transportation Research Record, 2678(5), 601–616.
[2] Tang, J., Wu, S., Yang, S., and Shi, Y. (2024). Resilience Assessment of Urban Road Transportation in Rainfall. Remote Sensing, 16(17), 3311.
[3] Jeong, D. Y., Baek, M. S., Lim, T. B., Kim, Y. W., Kim, S. H., Lee, Y. T., … and Lee, I. B. (2022). Digital twin: Technology evolution stages and implementation layers with technology elements. IEEE Access, 10, 52609–52620.
[4] Menon, D., Anand, B., and Chowdhary, C. L. (2023). Digital twin: exploring the intersection of virtual and physical worlds. IEEE Access.
[5] Argyroudis, S. A., Mitoulis, S. A., Chatzi, E., Baker, J. W., Brilakis, I., Gkoumas, K., … and Linkov, I. (2022). Digital technologies can enhance climate resilience of critical infrastructure. Climate Risk Management, 35, 100387.
[6] Sarker, I. H., Janicke, H., Mohsin, A., Gill, A., and Maglaras, L. (2024). Explainable AI for cybersecurity automation, intelligence and trustworthiness in digital twin: Methods, taxonomy, challenges and prospects. ICT Express.
[7] Feng, H., Lv, H., and Lv, Z. (2023). Resilience towarded digital twins to improve the adaptability of transportation systems. Transportation Research Part A: Policy and Practice, 173, 103686.
[8] Zhang, X., Han, D., Zhang, X., and Fang, L. (2023). Design and application of intelligent transportation multi-source data collaboration framework based on digital twins. Applied Sciences, 13(3), 1923.
[9] Chen, C., He, F., Yu, R., Wang, S., and Dai, Q. (2023). Resilience assessment model for urban public transportation systems based on structure and function. Journal of Safety Science and Resilience,4(4), 380–388.
[10] Wang, N., Wu, M., and Yuen, K. F. (2023). A novel method to assess urban multimodal transportation system resilience considering passenger demand and infrastructure supply. Reliability Engineering & System Safety, 238, 109478.
[11] Liao, T. Y., Hu, T. Y., and Ko, Y. N. (2018). A resilience optimization model for transportation networks under disasters. Natural hazards, 93, 469–489.
[12] Bhavathrathan B K, Patil G R. (2015). Quantifying resilience using a unique critical cost on road networks subject to recurring capacity disruptions. Transportmetrica A: Transport Science, 11(9):836–855.
[13] Cox, A., Prager, F., and Rose, A. (2011). Transportation security and the role of resilience: A foundation for operational metrics. Transport policy, 18(2), 307–317.
[14] Gonçalves, L. A. P. J., and Ribeiro, P. J. G. (2020). Resilience of urban transportation systems. Concept, characteristics, and methods. Journal of Transport Geography, 85, 102727.
[15] Gonçalves, L. A. P. J., and Ribeiro, P. J. G. (2020). Resilience of urban transportation systems. Concept, characteristics, and methods. Journal of Transport Geography, 85, 102727.
[16] Pan, S., Yan, H., He, J., and He, Z. (2021). Vulnerability and resilience of transportation systems: A recent literature review. Physica A: Statistical Mechanics and its Applications, 581, 126235.
[17] Nickdoost, N., Shooshtari, M. J., Choi, J., Smith, D., and AbdelRazig, Y. (2024). A composite index framework for quantitative resilience assessment of road infrastructure systems. Transportation Research Part D: Transport and Environment, 131, 104180.
[18] Zhou, Y., Wang, J., and Yang, H. (2019). Resilience of transportation systems: concepts and comprehensive review. IEEE Transactions on Intelligent Transportation Systems, 20(12), 4262–4276.
[19] Ji Tao, Yao Yanhong, Huang Xian. Research Progress and Future Development Trend of Urban Traffic Resilience [J]. Geographical Science Progress, 2023, 42(05), 1012–1024.
[20] Gonçalves, L. A. P. J., and Ribeiro, P. J. G. (2020). Resilience of urban transportation systems. Concept, characteristics, and methods. Journal of Transport Geography, 85, 102727.
[21] Kameshwar, S., Cox, D. T., Barbosa, A. R., Farokhnia, K., Park, H., Alam, M. S., and van de Lindt, J. W. (2019). Probabilistic decision-support framework for community resilience: Incorporating multi-hazards, infrastructure interdependencies, and resilience goals in a Bayesian network. Reliability Engineering & System Safety, 191, 106568.
[22] Tang, J., Heinimann, H., Han, K., Luo, H., and Zhong, B. (2020). Evaluating resilience in urban transportation systems for sustainability: A systems-based Bayesian network model. Transportation Research Part C: Emerging Technologies, 121, 102840.
[23] Kammouh, O., Gardoni, P., and Cimellaro, G. P. (2020). Probabilistic framework to evaluate the resilience of engineering systems using Bayesian and dynamic Bayesian networks. Reliability Engineering & System Safety, 198, 106813.
[24] Jonnalagadda, V., Lee, J. Y., Zhao, J., and Ghasemi, S. H. (2023). Quantification and Reduction of Uncertainty in Seismic Resilience Assessment for a Roadway Network. Infrastructures, 8(9), 128.
Biographies

Hongbo Qin Ph.D. Candidate, Senior Engineer. National Registered Cost Engineer, main research interests: Transportation Resilience, Intelligent Transportation Systems, Digital Governance and Engineering Cost Management.

Ahui Niu Master’s degree, Research, research interests: Transportation Engineering, Statistics.

Yifei Li Master’s Student, research Interests: Transportation Engineering, Radio and Television.

Wanyun Xia Ph.D. at Zhengzhou University, research interests: Intelligent Transportation Systems.
Journal of Graphic Era University, Vol. 14_1, 1–34.
doi: 10.13052/jgeu0975-1416.1411
© 2025 River Publishers