A Cross Validation of OSS Reliability Assessment Based on Deep Multimodal and Multitask Learning
Shan Jiang1,*, Yoshinobu Tamura1 and Shigeru Yamada2
1Yamaguchi University, Japan
2Tottori University, Japan
E-mail: c029few@yamaguchi-u.ac.jp; tamuray@yamaguchi-u.ac.jp; bex2yama@muse.ocn.ne.jp
*Corresponding Author
Received 16 August 2025; Accepted 19 September 2025
Abstract
In recent years, open source software (OSS) has become ubiquitous in every field of our daily life. Hence, the OSS’s reliability is a significant challenge. The traditional models, like the software reliability growth model, can not handle a large scale of data efficiently, while the deep learning provides an effective method. This paper proposes a multi-input multi-output deep neural network to predict the fault detection time intervals and the fault modification time intervals simultaneously. Additionally, we present several numerical examples with a cross validation conducted with 3 types of data splits.
Keywords: Software reliability, deep learning, open source software, deep multimodal and multitask learning.
1 Introduction
Open Source Software (OSS) is a type of software whose source code is available to any user and can be redistributed and edited by anyone. However, it faces challenges in assessing the software reliability due to the large number of users who are not centralized, which can lead to overwhelming bugs. Therefore, the software reliability becomes a significant factor. Traditional methods, such as the software reliability growth model, also have limitations, including strong assumptions and inadequate handling of complex data. To overcome those limitations, deep learning has become a new method for analyzing data.
In this paper, we introduce a multi-input and multi-output deep neural network model to predict the faults and the fault modification time intervals between each fault in 2 datasets from OpenStack and Apache HTTP server by using several numerical examples. For more accurate results, we altered the ratio between testing data and training data, and verified the validity of our proposed model.
2 Previous Research
2.1 Open Source Software
OSS refers to software whose source code is given to everyone. In this case, there are no vendors restricting access to the software’s fundamental code. So, the OSS developers are usually its users, and they can modify it themselves. This results in more freedom and faster innovation. However, since there is no established quality control method, it has unique challenges in assessing reliability. For it relies on users, and the OSS knowledge of every user differs, some users may be exposed to safety hazards without knowing it. Despite the disadvantage, OSS is spreading quickly in our society, such as OpenStack, Apache HTTP server, and Linux [1, 2, 3, 4].
2.2 Cloud Computing
OpenStack mentioned above is an OSS platform for cloud computing. Cloud computing is a new paradigm of access to a convenient, on-demand network that shares the computing resources, for example, networks, databases, and storage. Cloud computing has several attributes. First, a user can demand the computing capabilities without contacting the provider. It also allows the OSS users to use its service on any platform, like computers, smartphones, or tablets. The services can often be provided instantly, and it is usually unlimited. However, the user can only use the pooled services. The users have no access to manage the service. Additionally, the service usage is monitored for both the user and provider [5, 6].
2.3 Web Server
A computer having access to the Internet can connect to others, such as acting as a web server. Simply, a web server is the underlying hardware and software that receives requests via HTTP from users on the Internet. Once it receives requests, it deciphers each request and sends files back to the “client,” which are mostly web browsers. Moreover, it can also store files [7].
2.4 Software Reliability
Lately, the combination of several software called IoT (Internet of Things) has grown rapidly, and the combination of AI and IoT is developing. The meaning of this is that software is a major part of our daily lives. Thus, unlike in the past, software failure can cause major problems in any field nowadays. Therefore, the software reliability gives us a view of the ability of software to determine how long it can run without encountering failure [8].
2.5 Deep Learning
Nowadays, it is hard to process big, complex raw data using SRGMs due to the non-linear, high-dimensional data in bug tracking systems. To solve these problems, deep learning is used by presenting the characteristics in terms of more straightforward representations. This means that deep learning learns and optimizes the features for raw data, which lowers the manual labor. When more data is added, the model can learn automatically [9, 10]. Furthermore, with more data, the model is more accurate.
2.6 Deep Neural Network
A deep neural network (DNN) is a type of artificial neural network with multiple hidden layers between the input and output layers. With numerous hidden layers, the DNNs build a structure where deeper layers combine lower layers, which learn simpler features to learn more abstract features. The shallow networks may face a performance limit on large datasets. However, DNNs thrive on these, and their ability scales with larger data [11, 12].
3 Proposed Method
3.1 Learning Method
In this paper, we use the fault data for the software reliability assessment. We focus on 2 time intervals obtained from the opened and changed columns from the OpenStack and Apache HTTP server datasets. Then the formula of the time intervals for detected faults and modifications is as shown:
| (1) | ||
| (2) |
where is the time interval between the -th and -th fault, which is “ opened” , and is the time interval of fault modification between the -th fault and -th one, which is “changed” . Then, is the time when the -th fault is opened. Similarly, is the time when the -th fault is modified. It is important to address that the changed time intervals are not calculated in chronologically changed time, but by the order of fault opened time. Specifically, this means that the order of the changed time is by their opened times. Consequently, if a later opened fault was modified before a previously opened fault, the value of the changed time interval becomes negative. To avoid this, we use the max function to convert all negative values to 0. Therefore, when increases, the software reliability grows. Moreover, the increase of yi means efficient debugging.
3.2 Model Architecture
Multitask learning can be used to predict OSS quality indicators simultaneously, such as fault detection time, fault modification completion time, bug severity, and defect density. This model uses a multitask learning structure, which has shared layers learning representations from inputs and branches out to predict fault detection time and fault modification completion time simultaneously. Comparing the single-task learning, with the multitask learning has better performance. First, the multitask learning performs better because it learns from related tasks and is used as a regularizer. Second, the multitask learning is more computationally efficient by reducing training and testing times. Then, the multitask learning makes models more flexible when faced with less data [13, 14].
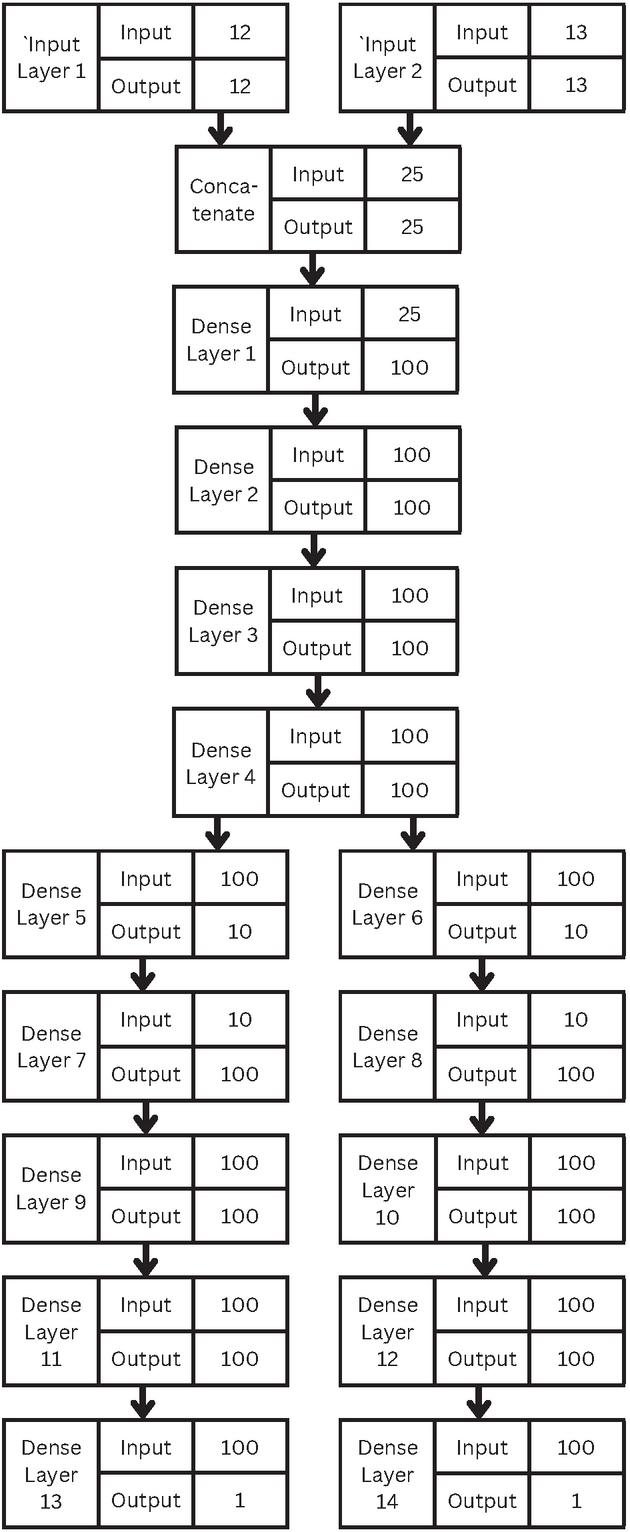
Figure 1 The model structure as an example of the proposed deep learning.
This model is a multi-input, multi-output deep neural network, the architecture is shown in Figure 1.
This model, implemented in TensorFlow, starts with 2 independent input layers receiving data from 2 datasets. These 2 inputs are combined into a concatenation layer. Then, it has 4 hidden layers before branching out, each layer has 100 neurons. In each branch, it has 4 more layers with 100 neurons until the single-neuron output layers. One predicts the opened time interval, and the other one predicts the changed time interval. This multi-task learning method allows the model to predict 2 different values simultaneously.
3.3 Training and Evaluation
The activation function of this model is ReLU. For compilation, we use the “Adam” optimizer. Then, the mean squared error (MSE) is employed as the loss function, also as the metric for the evaluation of both training and testing. Overall, the model is trained for 100 epochs with a batch size of 100.
4 Training and Evaluation
In this paper, we use the datasets obtained from OpenStack[15] and the Apache HTTP server project[16] to show several numerical examples. Since the OpenStack dataset has more rows of data than the Apache HTTP server project dataset, we must trim the OpenStack dataset to match the number of rows in the Apache HTTP server project dataset. We chose the data from August 30th, 2018. This is because: First, the Apache data ranges from 2002 to 2020, while the OpenStack data ranges from 2012 to 2021. Both datasets have a wide range of timelines. However, the Apache HTTP server launched in April 1995, while OpenStack launched in October 2010. This could mean the data of OpenStack could not be as stable as the Apache one since OpenStack has been developed for only 2 years. Second, instead of choosing random rows of data from the OpenStack dataset, choosing consistent data from 2017 onwards can represent the current state of this dataset.
To ensure this model is not sensitive to a random train-test data split, we perform a cross-validation. This model uses cross-validation to verify its robustness and validity. This method is used to make sure that its results and performances do not depend on a specific data split. Therefore, it offers a reliable measurement of robustness. We use 3 different data splits: 90% for training and 10% for testing, 80% to 20%, and 70% to 30%. The following features in both datasets are used for the objective variables:
• Fault detection time
• Fault modification completion time
The other features that are used as explanatory variables are:
• Bug ID
• Fault assignee
• Fault reporter
• Software product
• Software component
• Fault resolution
• Fault resolution status
• Hardware type
• Operation system type
• Fault severity
• Software version
• Fault Summary
• Software component/Operation system type
• Software component/Hardware type
Then, we use the frequency encoding from the obtained datasets.
4.1 Model Performance (10% testing data)
First, we run this model with 10% data as testing data. Figures 2–8 present the estimated error for validation and training data of the fault detection time intervals, the estimated error for validation and training data of the fault modification time intervals, the estimated fault detection time intervals, the estimated fault modification time intervals, the estimated scatter plot of fault detection time intervals, the estimated scatter plot of fault modification time intervals, and the estimated OSS performability.
Performability is a new metric. We introduced to provide a comprehensive assessment of OSS reliability. The performability is defined as
| (3) |
where is the predicted fault detection time intervals and is the predicted fault modification time intervals. It ranges from 0 to 1. If the performability is high, it means that the bugs have been reduced and high efficiency in debugging. On the other hand, the bugs might be overwhelming and low efficiency in debugging if performability is low.
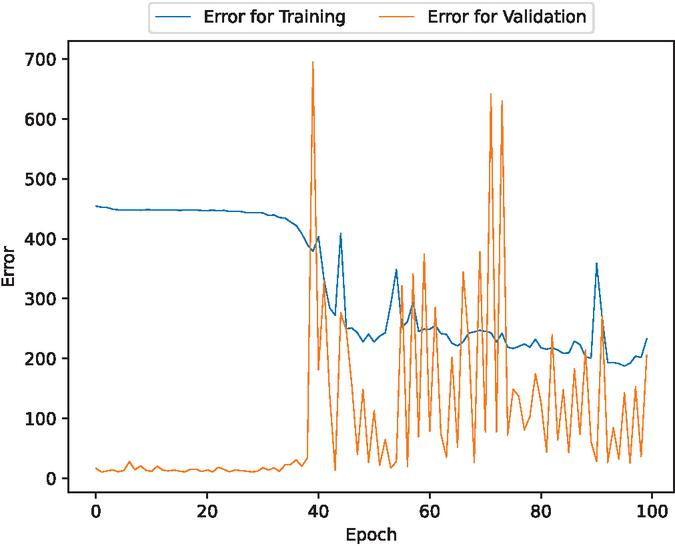
Figure 2 The estimated error for validation and training data of the fault detection time intervals (In the case of 90% training data).
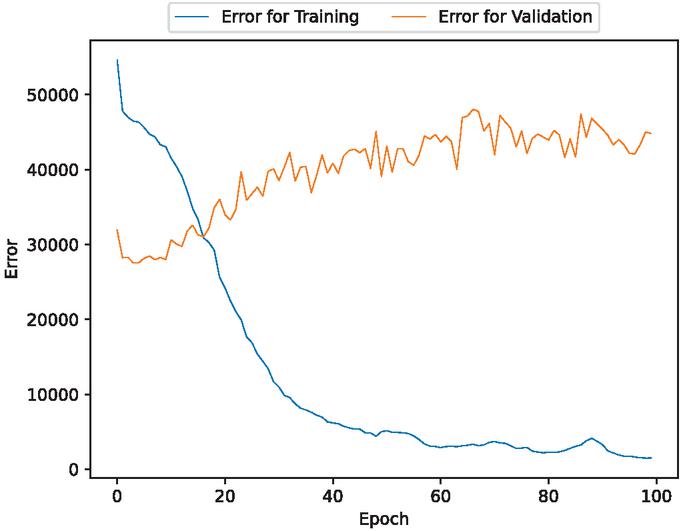
Figure 3 The estimated error for validation and training data of the fault modification time intervals (In the case of 90% training data).
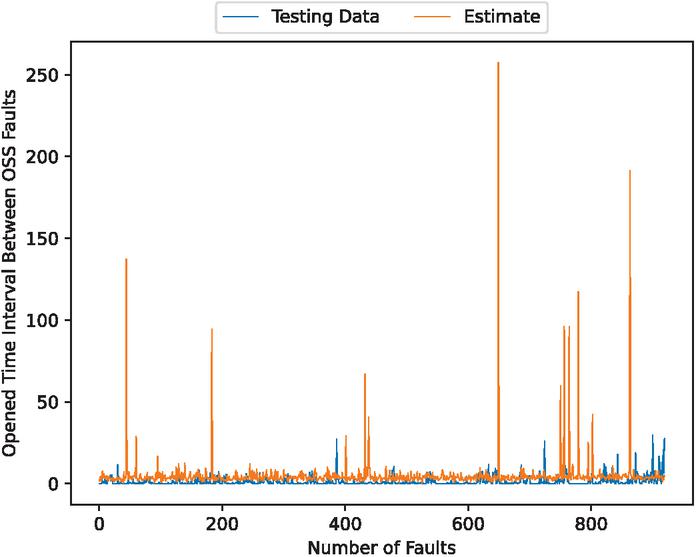
Figure 4 The estimated fault detection time intervals (In the case of 90% training data).
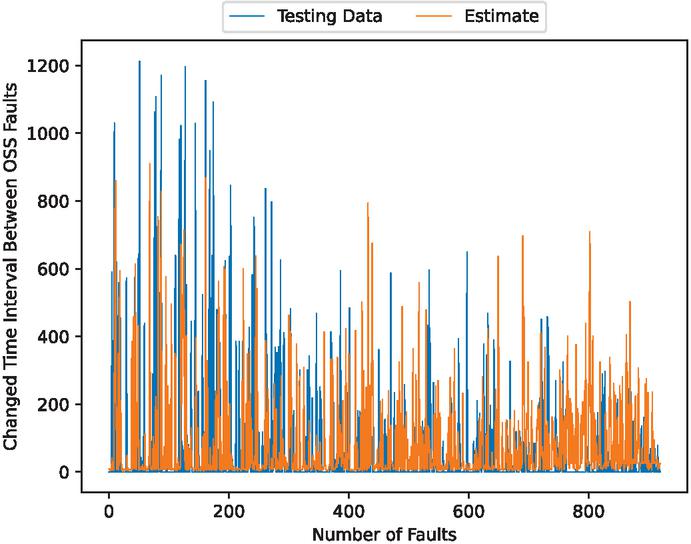
Figure 5 The estimated fault modification time intervals (In the case of 90% training data).
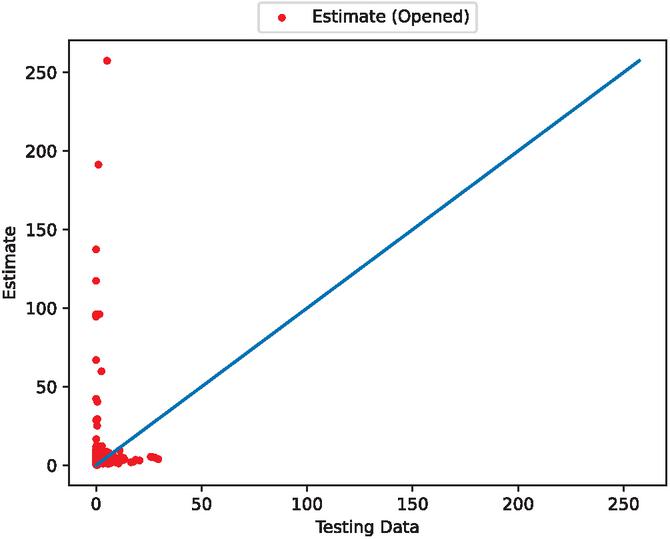
Figure 6 The estimated scatter plot of fault detection time intervals (In the case of 90% training data).
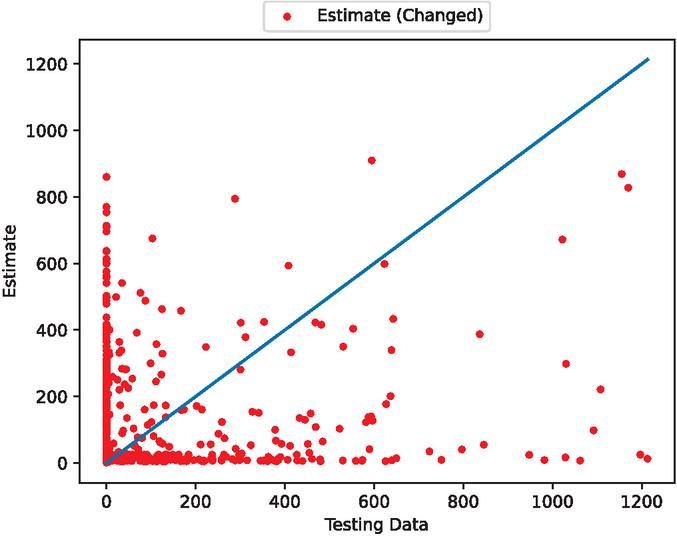
Figure 7 The estimated scatter plot of fault modification time intervals (In the case of 90% training data).
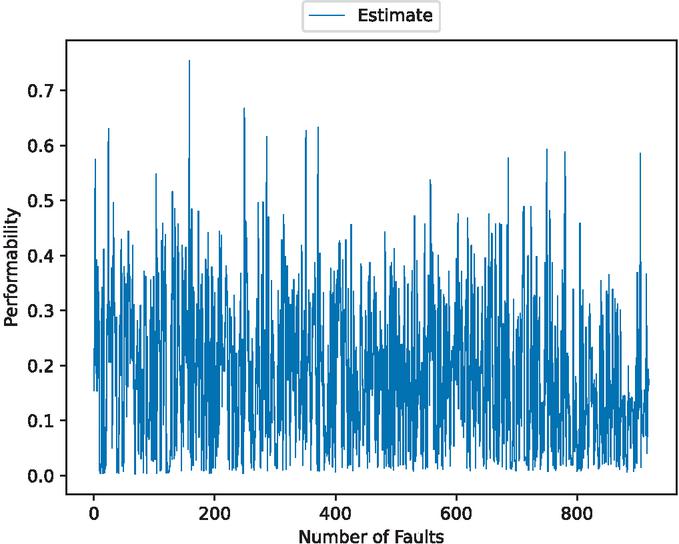
Figure 8 The estimated OSS performability (In the case of 90% training data).
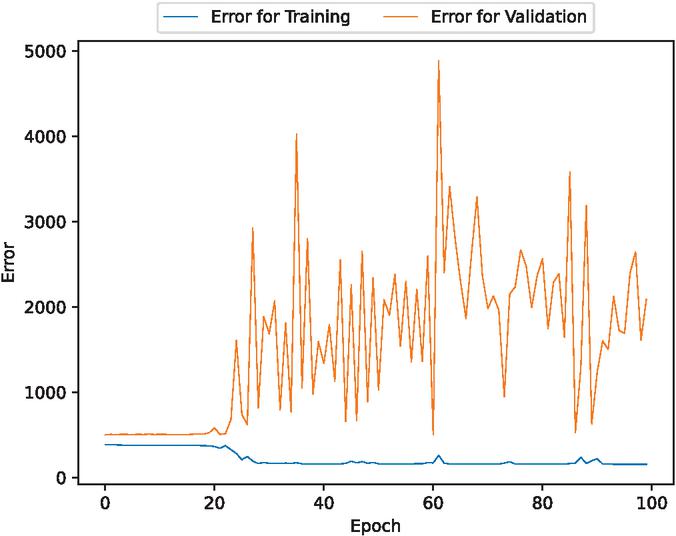
Figure 9 The estimated error for validation and training data of the fault detection time intervals (In the case of 80% training data).
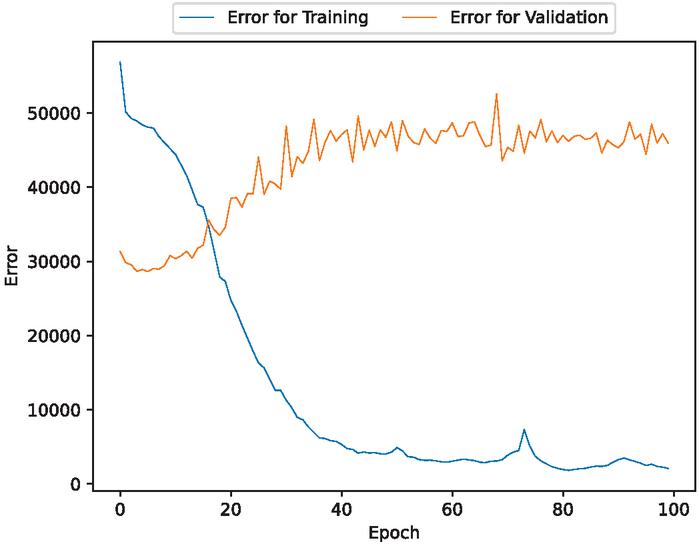
Figure 10 The estimated error for validation and training data of the fault modification time intervals (In the case of 80% training data).
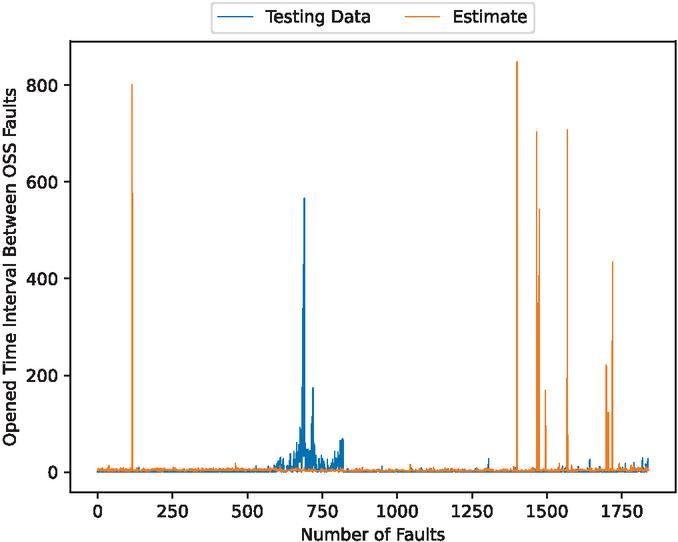
Figure 11 The estimated fault detection time intervals (In the case of 80% training data).
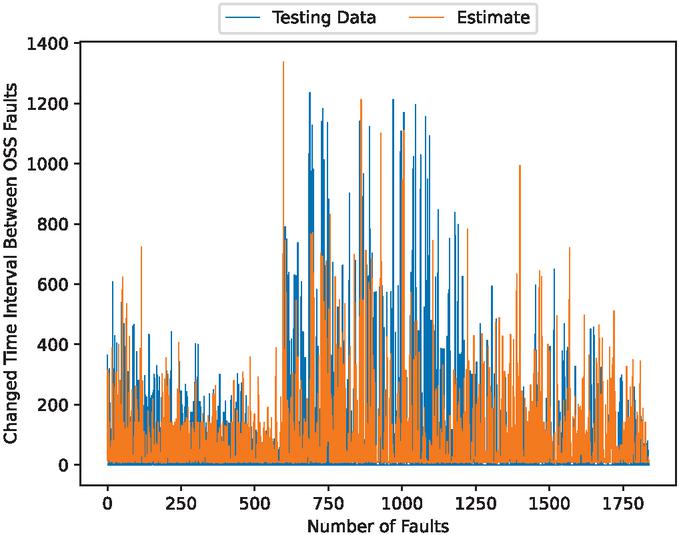
Figure 12 The estimated fault modification time intervals (In the case of 80% training data).
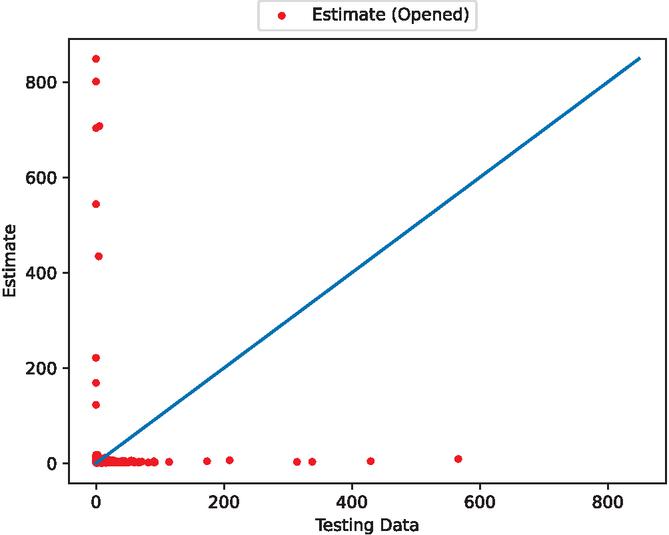
Figure 13 The estimated scatter plot of fault detection time intervals (In the case of 80% training data).
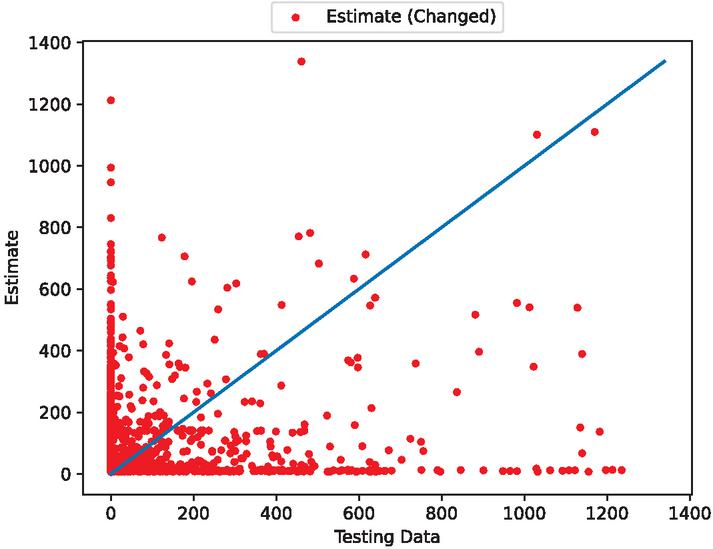
Figure 14 The estimated scatter plot of fault modification time intervals (In the case of 80% training data).
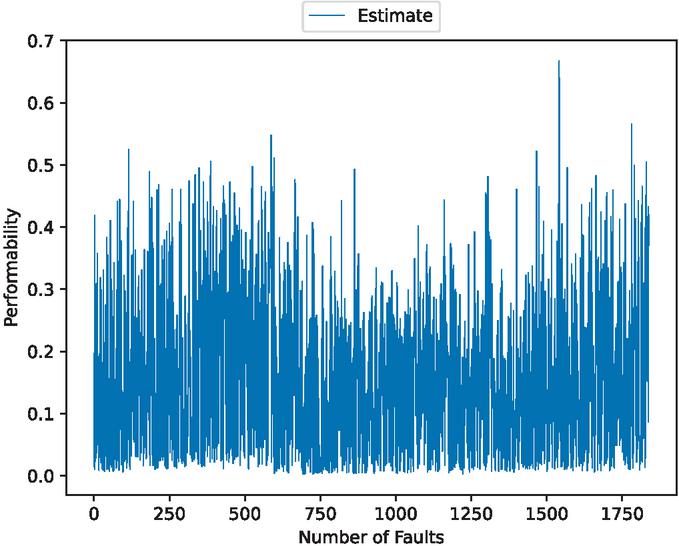
Figure 15 The estimated OSS performability (In the case of 80% training data).
4.2 Model Performance (20% testing data)
Second, we run this model with 20% data as testing data for cross-validation. Figures 9–15 present the estimated error for validation and training data of the fault detection time intervals, the estimated error for validation and training data of the fault modification time intervals, the estimated fault detection time intervals, the estimated fault modification time intervals, the estimated scatter plot of fault detection time intervals, the estimated scatter plot of fault modification time intervals, and the estimated OSS performability.
4.3 Model Performance (30% Testing Data)
Finally, we run this model with 30% data as testing data for cross-validation. Figures 16–22 present the estimated error for validation and training data of the fault detection time intervals, the estimated error for validation and training data of the fault modification time intervals, the estimated fault detection time intervals, the estimated fault modification time intervals, the estimated scatter plot of fault detection time intervals, the estimated scatter plot of fault modification time intervals, and the estimated OSS performability.
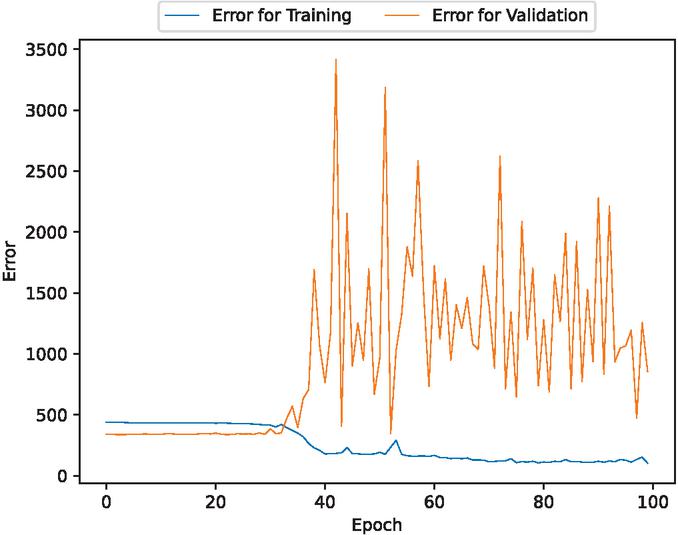
Figure 16 The estimated error for validation and training data of the fault detection time intervals (In the case of 70% training data).
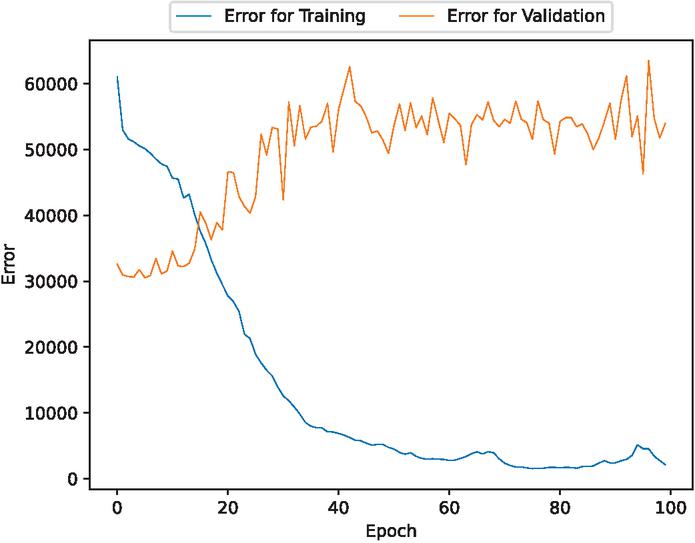
Figure 17 The estimated error for validation and training data of the fault modification time intervals (In the case of 70% training data).
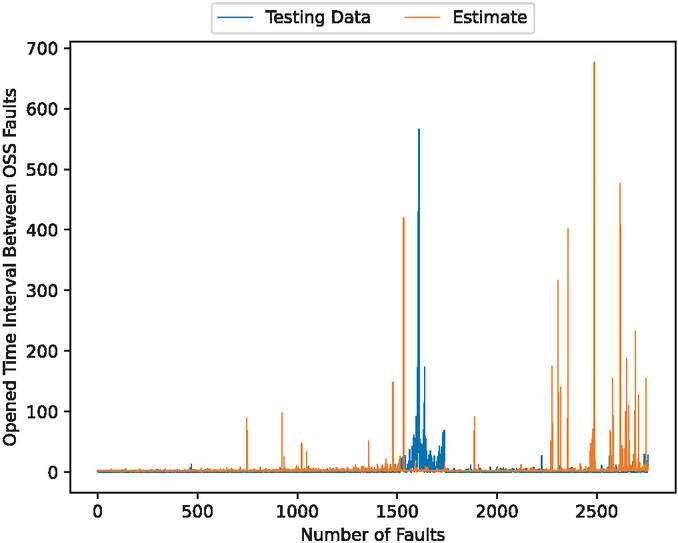
Figure 18 The estimated fault detection time intervals (In the case of 70% training data).
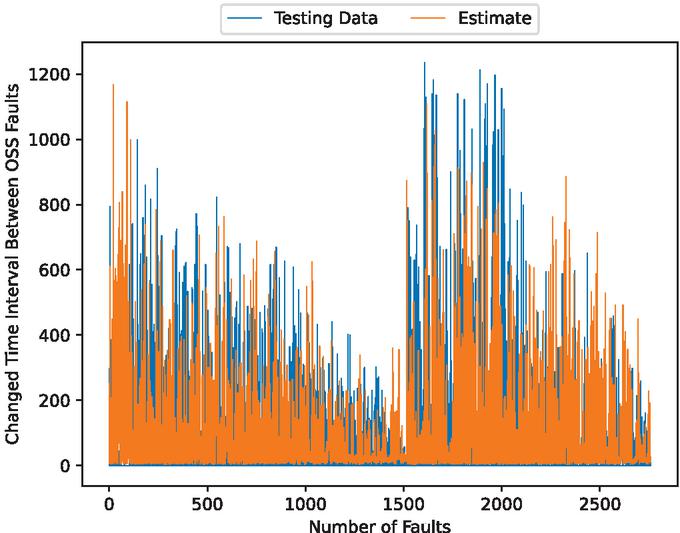
Figure 19 The estimated fault modification time intervals (In the case of 70% training data).
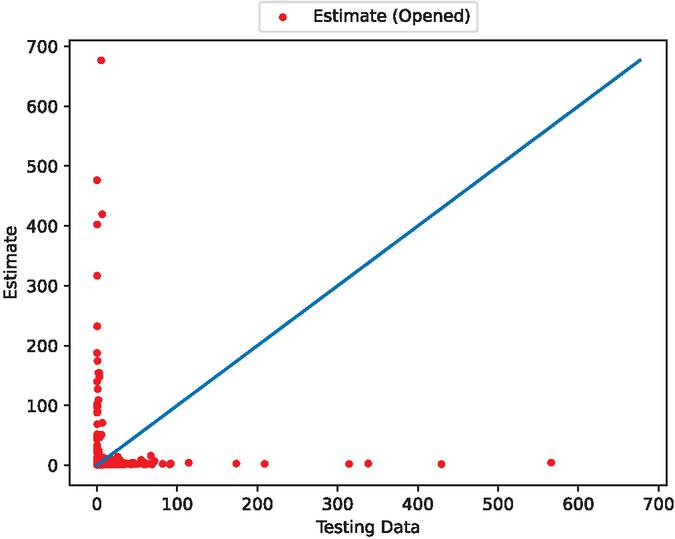
Figure 20 The estimated scatter plot of fault detection time intervals (In the case of 70% training data).
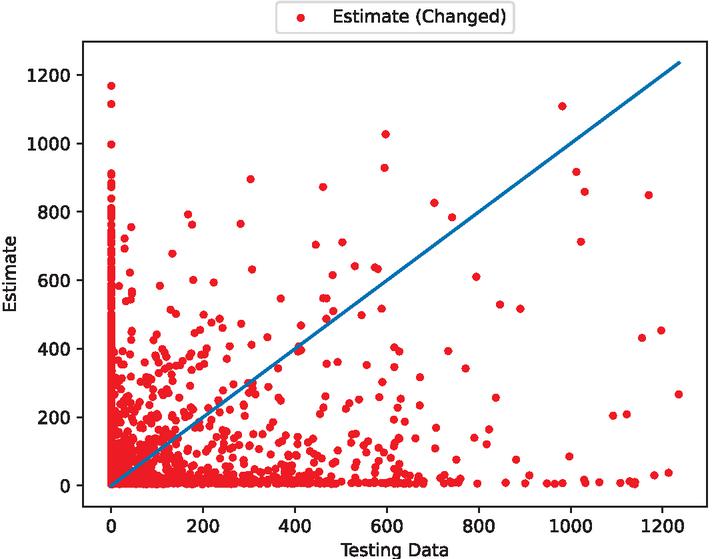
Figure 21 The estimated scatter plot of fault modification time intervals (In the case of 70% training data).
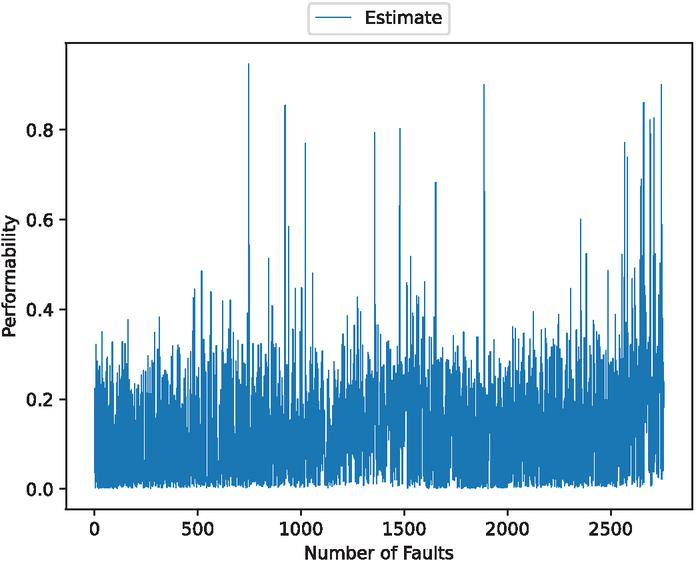
Figure 22 The estimated OSS performability (In the case of 70% training data).
4.4 Discussion
Table 1 shows the MSE results for each split. These results show that the 10% testing split has the lowest MSE for the fault detection time intervals. In terms of the fault modification time intervals, all splits have high MSEs.
Table 1 MSE results for different training/testing splits
| Training Data | Test Total | Test MSE | Test MSE |
| Percentage | Loss | (Detection) | (Modification) |
| 90% | 45022.7305 | 204.4940 | 44504.8594 |
| 80% | 48041.8398 | 2071.6621 | 45554.9727 |
| 70% | 54799.2344 | 847.7702 | 53473.3203 |
Figures 2, 3, 9, 10, 16, and 17 show that the errors for training of both target variables are consistently decreasing over epochs. For the validation errors, they spike and are not stable. This suggests that there may be an overfitting problem.
Figures 4, 6, 11, 13, 18, and 20 show that this model underpredicts the unusual spikes. However, it focuses on the accuracy of normal values over the outliers.
Figures 5, 7, 12, 14, 19, and 21 show that this model follows the general trends. However, it underestimates or overestimates the volatile parts of this dataset. From the scatter plots, we can see that many predictions are spread along the axes. This is because during the preprocessing of the data, many values are set to 0. However, we can see that the scatter points are dropped around the ideal prediction line.
4.5 Limitations
While this method provides a robustness check for our model based on OSS datasets, it is limited in proprietary software (PS) reliability assessment. This is mainly because of the difference between OSS and PS. PS has limited and consistent user feedback, while OSS has feedback from the public, which results in inconsistent feedback. The model trained on OSS datasets will not learn the representative of PS. Consequently, the results of cross-validation may not generalize well in PS reliability assessment [17].
This model may have an overfitting problem. It is shown that as the number of epochs increase, the validation errors also increase and are not stable, whereas the training errors consistently decrease. Additionally, this model has trouble predicting outliers. It underpredicts unusual spikes in fault detection time intervals and misses some volatile values of fault modification time intervals.
5 Concluding Remarks
In this paper, we propose a multi-input multi-output deep neural network in order to predict the fault detection time intervals and the fault modification time intervals simultaneously from OpenStack and Apache HTTP server project data sets. We also make a cross validation on 3 different data splits: 10%, 20% and 30% testing data to validate this model’s robustness. Also, we introduced performability as a new metric for software reliability.
For future work, there are several improvements that can be made. First, this model mainly focuses on features of bug tracking systems, adding other multimodal features, such as code metrics and version history, can improve reliability assessment. Second, this model faces a problem of overfitting and an inability to predict outliers. To solve these problems, we can use early stopping and other ways to handle negative values of the fault modification time intervals. Finally, adopting this model to PS is a challenge too. Using transfer learning can help the results of cross-validation be generalized to PS reliability assessment [18, 19, 20].
Acknowledgments
This work was supported in part by the JSPS KAKENHI Grant No. 23K11066 in Japan.
References
[1] Y. Tamura and S. Yamada, Applied OSS Reliability Assessment Modeling, AI and Tools: Mathematics and AI for OSS Reliability Assessment, First edition. Cham, Switzerland: Springer, 2024. doi: \nolinkurl10.1007/978-3-031-64803-8.
[2] S. Yamada and Y. Tamura, OSS Reliability Measurement and Assessment. 1st ed. 2016. Cham: Springer International Publishing, 2016. doi: \nolinkurl10.1007/978-3-319-31818-9.
[3] S. Miyamoto, Y. Tamura, and S. Yamada, “A method of reliability assessment based on trend analysis for open source software,” International Journal of Reliability, Quality & Safety Engineering, vol. 31, no. 4, pp. 1–15, 2024, doi: \nolinkurl10.1142/S0218539324500049.
[4] S. Miyamoto, Y. Tamura, and S. Yamada, “Reliability assessment tool based on deep learning and data preprocessing for OSS,” American Journal of Operations Research, vol. 12, pp. 111–125, 2022, doi: \nolinkurl10.4236/ajor.2022.123007.
[5] P. Mell and T. Grance, “The NIST definition of cloud computing,” NIST Special Publication, vol. 800-145, Gaithersburg, MD: National Institute of Standards and Technology, 2011.
[6] T. Atmaca, T. Begin, A. Brandwajn, and H. Castel-Taleb, “Performance evaluation of cloud computing centers with general arrivals and service,” IEEE Transactions on Parallel and Distributed Systems, vol. 27, no. 8, pp. 2341–2348, 2016, doi: \nolinkurl10.1109/TPDS.2015.2499749.
[7] N. J. Yeager and R. E. McGrath, Web Server Technology. San Francisco, CA, USA: Morgan Kaufmann, 1996.
[8] Y. S. Kim, K. Y. Song, H. Pham, and I. H. Chang, “A software reliability model with dependent failure and optimal release time,” Symmetry, vol. 14, no. 2, p. 343, 2022, doi: \nolinkurl10.3390/sym14020343.
[9] I. Goodfellow, Y. Bengio, and A. Courville, Deep Learning. London, England: MIT Press, 2016.
[10] Y. LeCun, Y. Bengio, and G. Hinton, “Deep learning,” Nature, vol. 521, no. 7553, pp. 436–444, 2015, doi: \nolinkurl10.1038/nature14539.
[11] P. Covington, J. Adams, and E. Sargin, “Deep neural networks for YouTube recommendations,” in Proc. 10th ACM Conf. Recommender Systems, New York, NY, USA, 2016, pp. 191–198, doi: \nolinkurl10.1145/2959100.2959190.
[12] G. Hinton et al., “Deep neural networks for acoustic modeling in speech recognition: The shared views of four research groups,” IEEE Signal Processing Magazine, vol. 29, no. 6, pp. 82–97, 2012, doi: \nolinkurl10.1109/MSP.2012.2205597.
[13] Q. Li, L. Li, Y. Shao, R. Wang, and H. Hao, “A multi-task machine learning approach for data efficient prediction of blast loading,” Engineering Structures, vol. 326, Art. no. 119577, 2025, doi: \nolinkurl10.1016/j.engstruct.2024.119577.
[14] T. Marquet et al., “A Comparison of Multi-task Learning and Single-Task Learning Approaches,” Applied Cryptography and Network Security Workshops, vol. 13907, Switzerland: Springer, 2023, pp. 121–138. doi: \nolinkurl10.1007/978-3-031-41181-6_7.
[15] The OpenStack Project, OpenStack. [Online]. Available: https://www.openstack.org/.
[16] The Apache Software Foundation, The Apache HTTP Server Project. [Online]. Available: https://www.apache.org/.
[17] J. Wang and C. Zhang, “An Open-Source Software Reliability Model Considering Learning Factors and Stochastically Introduced Faults,” Applied Sciences, vol. 14, no. 2, p. 708, 2024, doi: \nolinkurl10.3390/app14020708.
[18] F. Zhuang et al., “A Comprehensive Survey on Transfer Learning,” Proceedings of the IEEE, vol. 109, no. 1, pp. 43–76, 2021, doi: \nolinkurl10.1109/JPROC.2020.3004555.
[19] S. Tang, S. Huang, C. Zheng, E. Liu, C. Zong, and Y. Ding, “A novel cross-project software defect prediction algorithm based on transfer learning,” Tsinghua science and technology, vol. 27, no. 1, pp. 41–57, 2022, doi: \nolinkurl10.26599/TST.2020.9010040.
[20] O. P. Omondiagbe, S. A. Licorish, and S. G. MacDonell, “Improving transfer learning for software cross-project defect prediction,” Applied intelligence (Dordrecht, Netherlands), vol. 54, no. 7, pp. 5593–5616, 2024, doi: \nolinkurl10.1007/s10489-024-05459-1.
Biographies

Shan Jiang is currently a senior student at Yamaguchi University in Japan. His research interests the reliability assessment method of OSS at Yamaguchi University, Ube, Japan.

Yoshinobu Tamura received the B.S.E., M.S., and Ph.D. degrees from Tottori University in 1998, 2000, and 2003, respectively. From 2003 to 2006, he was a Research Assistant at Tottori University of Environmental Studies. From 2006 to 2009, he was a Lecturer and Associate Professor at Faculty of Applied Information Science of Hiroshima Institute of Technology, Hiroshima, Japan. From 2009 to 2017, he was an Associate Professor at the Graduate School of Sciences and Technology for Innovation, Yamaguchi University, Ube, Japan. From 2017 to 2019, he has been working as a Professor at the Faculty of Knowledge Engineering, Tokyo City University, Tokyo, Japan. Since 2020, he has been working as a Professor at the Faculty of Information Technology, Tokyo City University, Tokyo, Japan. Since 2021, he has been working as a Professor at the Graduate School of Sciences and Technology for Innovation, Yamaguchi University, Ube, Japan. His research interests include reliability assessment for open source software, big data, clouds, reliability. He is a regular member of the Institute of Electronics, the Information and Communication Engineers of Japan, the Operations Research Society of Japan, the Society of Project Management of Japan, the Reliability Engineering Association of Japan, and the IEEE. He has authored the book entitled as OSS Reliability Measurement and Assessment (Springer International Publishing, 2016). Dr. Tamura received the Presentation Award of the Seventh International Conference on Industrial Management in 2004, the IEEE Reliability Society Japan Chapter Awards in 2007, the Research Leadership Award in Area of Reliability from the ICRITO in 2010, the Best Paper Award of the IEEE International Conference on Industrial Engineering and Engineering Management in 2012, the Honorary Professor from Amity University of India in 2017, the Best Paper Award of the 24th ISSAT International Conference on Reliability and Quality in Design in 2018, the Outstanding Paper Award of the IEEE International Conference on Industrial Engineering and Engineering Management in 2022, and the Amity Global Academic Excellence Award of the IEEE 4th International Conference on Intelligent, Engineering & Management in 2023.

Shigeru Yamada was born in Hiroshima Prefecture, Japan, on July 6, 1952. He received the B.S.E., M.S., and Ph.D. degrees from Hiroshima University, Japan, in 1975, 1977, and 1985, respectively. From 1993/10 to 2018/3, he had been working as a professor at the Department of Social Management Engineering, Graduate School of Engineering, Tottori University, Tottori-shi, Japan. He is an Emeritus Professor of Tottori University. He has been also a Honorary Professor at Amity University, India, since 2015. His research interests include software reliability engineering, quality management engineering, and project management. He has published over 600 reviewed technical papers in the area of software reliability engineering, project management, reliability engineering, and quality control. He has authored several books entitled such as Introduction to Software Management Model (Kyoritsu Shuppan,1993), Software Reliability Models: Fundamentals and Applications (JUSE, Tokyo, 1994), Statistical Quality Control for TQM (Corona Publishing, Tokyo, 1998), Software Reliability: Model, Tool, Management (The Society of Project Management, 2004), Quality-Oriented Software Management (Morikita Shuppan, 2007), Elements of Software Reliability-Modeling Approach-(Kyoritsu Shuppan, 2011), Project Management (Kyoritsu Shuppan, 2012), Software Engineering-Fundamentals and Applications-(Science, Tokyo, 2013), Software Reliability Modeling: Fundamentals and Applications (Springer-Verlag, Tokyo/Heidelberg, 2014), and OSS Reliability Measurement and Assessment (Springer International Publishing, Switzerland, 2016). Dr. Yamada received the Best Author Award from the Information Processing Society of Japan in 1992, the TELECOM System Technology Award from the Telecommunications Advancement Foundation in 1993, the Best Paper Award from the Reliability Engineering Association of Japan in 1999, the International Leadership Award in Reliability Engg. Research from the ICQRIT/SREQOM in 2003, the Best Paper Award at the 2004 International Computer Symposium, the Best Paper Award from the Society of Project Management in 2006, the Leadership Award from the ISSAT (International Society of Science and Applied Technologies, U.S.A.) in 2007, the Outstanding Paper Award at the IEEE International Conference on Industrial Engineering and Engineering Management (IEEM2008) in 2008, the International Leadership and Pioneering Research Award in Software Reliability Engineering from the SREQOM/ICQRIT in 2009, the Exceptional International Leadership and Contribution Award in Software Reliability at the ICRITO’2010, the 2011 Best Paper Award from the IEEE Reliability Society Japan Chapter in 2012, the Leadership Award from the ISSAT in 2014, the Project Management Service Award from the Society of Project Management, “Honorary Canon” Appointment from the Korean Reliability Society in 2014, Title of “Honorary Professor” Recognition from Amity University, India, in 2015, Contribution Award for Promoting OR from the Operations Research Society of Japan in 2017, Research Award for Outstanding Contributions in Software Reliability Engineering from the ISSAT in 2017, Best Paper Award at the ISSAT International Conference on Reliability and Quality in Design in 2018, Society Award from the Society of Project Management in 2020, IEEE Reliability Society Japan Joint Chapter 2020 Reliability Engineering Award in 2021, and Lifetime Achievement Award from the ISSAT in 2025. He is a life member of the IEICE, a life member of the Information Processing Society of Japan, member of the Operations Research Society of Japan (Fellow Member), the Japanese Society for Quality Control, and the Society of Project Management, and the IEEE Life Member. He is also an Honorary Canon of the Korean Reliability Society.
Journal of Graphic Era University, Vol. 14_1, 53–78.
doi: 10.13052/jgeu0975-1416.1413
© 2025 River Publishers