Machine Learning Based Prediction and Impact Analysis of Various Lockdown Stages of COVID-19 Outbreak – A Case Study of India
Jaspreet Kaur1, Pallavi Chattopadhyay2, Lakhwinder Singh3,*, Kausik Chattopadhyay4 and Nitin Mishra5
1Department of Computer Science and Engineering, Sri Guru Granth Sahib World University, Fatehgarh Sahib, Punjab, India
2Department of Earth Sciences, Indian Institute of Technology Roorkee, Roorkee, India
3Department of Water Resource Development and Management, Indian Institute of Technology Roorkee, Roorkee, India
4Technical Officer III, ICC, Indian Institute of Technology Roorkee, Roorkee, India
5Department of Civil Engineering, Graphic Era Deemed to be University, Dehradun, Uttarakhand, India
E-mail: nitinuagfce@geu.ac.in
*Corresponding Author
Received 06 January 2021; Accepted 18 February 2021; Publication 29 June 2021
Abstract
Various measures have been taken into account for the virus outbreak. But how much it successes to control outbreak to fights against COVID-19. Machine learning is used as a tool to study these complex impacts on various stages of the epidemic. While India is forced to open up the economy after an extended lockdown, the effect of lockdown, which is critical to decide the future course of action, is yet to be understood. The study suggests Support Vector Machine (SVM) and Polynomial Regression (PR) are better suited compared to Long Short-Term Memory (LSTM) in scenarios consisting of sparse and discrete events. The time-series memory of LSTM is outperformed by the contextual hyperplanes of SVM which classifies the data even more precisely. The study suggests while phase 1 of lockdown was effective, the rest of them were not. Had India continued with lockdown 1, it would have flattened the COVID-19 infection curve by mid of May 2020. With the current rate, India will hit the 8 million mark by 23 October 2020. The SVM model is further integrated with an SIR (Susceptible, Infected and Recovered) model of epidemiology, which suggests that 70% of India’s population is infected by this pandemic during this 8 month and the peak reached in October 2020 if vaccine not found. With increasing recovery rate increases the possibility of decreasing COVID-19 cases. According to the SVM model’s prediction, 90% of cases of COVID-19 will be end in February.
Keywords: COVID-19, machine learning, SVM, SIR model, lockdown predictions.
1 Introduction
The world is challenged by the spread of COVID-19. It is a high contagion, and therefore the World Health Organization (WHO) has declared it a world public health emergency (Tomar and Gupta, 2020). The first outbreak of COVID-19 was detected in Hubei, China (Chakraborty and Ghosh, 2020), and it spread rapidly all over the world within a very short period (Singh et al., 2020). The symptoms of COVID-19 are typically fever, cough, breathlessness, fatigue, malaise, amongst others (T. Singhal, 2020).
India has a total of 17.7% population of the World (Hassanien et al., 2020). The first case of COVID-19 was reported in India on 30th of January, 2020. India has had 1251 confirmed cases, and 32 deaths cases reported on March 30th (Chatterjee et al., 2020).Two-thirds of casualties had diabetes, cancer, or cardiovascular diseases. Most impacted age group is 80–89 years of which 42.2% died out of which 32.4% had infections history of past and belong to the age group of 70–79 years; 8.4% belong to age group 60–69 years and 2.8% belong to age group 50–59 years (Remuzzi and Remuzzi, 2020). On March 24th, 2020 the Indian government announced lockdown in India. The human-to-human transmission rate was reduced by 50% of the estimated rate due to lockdown (Paul et al., 2020).
India was going through the world’s biggest pandemic lockdown (Ghosh et al., 2020), and COVID-19 cases in India were comparatively much lesser than other countries suggesting a much lesser rate of spread. However, the lockdown affected the daily wagers very badly and the substantial percentage of them were migrant workers. Even though lockdown controlled the COVID-19 infections in India, the economy suffered badly (Mahendra Dev and Sengupta, 2020). The extended lockdown (Table 1) resulted in an exodus of the migrant workers, resulting in the violation of many of the lockdown measures. Even though the administration was trying their best, India, with over 1.3 billion of the population (Hassanien et al., 2020) was facing the worst challenges of the century.
Table 1 Lockdown stages in India- describes the various lockdown stages from 25th of May to 14th of April, 2020
| Lockdown Stages | Dates (in 2020) | Remarks |
| Lockdown 1 (LC1) | 25th March to 14th April | Everything closed except for emergency workers* |
| Lockdown 2 (LC2) | 15th April to 3rd May | Relaxation 1* |
| Lockdown 3 (LC3) | 4th May to 17th May | Relaxation 2* |
| Lockdown 4 (LC4) | 18th may to 31st of May | Relaxation 3* |
| No Lockdown | 1st of June to till date | Restriction 1* |
| *Date wise guidelines at https://www.mha.gov.in/media/whats-new | ||
After a lockdown period of more than 2 months, India had to revive the economy, and at present, India faces a national and global emergency, and it will take a considerable time to recover from this global pandemic and return to normalcy (Ray et al., 2020). The COVID-19 infection trend in India in the past few days are increasing. The administration and health system in a certain part of the country is overwhelmed. Therefore, it is critical to have a modelling system that allows parameters to be re pivoted to incorporate the impact of prevailing situations and events, which may present more precise predictions to help administration and health works respond effectively.
Long Short Term Memory (LSTM) (Barmparis and Tsironis, 2020; Li et al., 2020; Pandey et al., 2019; Petropoulos and Makridakis, 2020; Ribeiro et al., 2020; Roosa et al., 2020; Tomar and Gupta, 2020) is expected to be a good candidate for pandemic modelling where time-series analyses are required and have dependencies on the past events. However, when the time window is less (daily data pertaining only to past 2–3 months), the analyses become challenging due to the lack of time-series data. Moreover, it fails to incorporate the challenges posed by various discrete and sparse events such as movements of migrants, compliance to the lockdown norms, religious gatherings that are outliers otherwise but influences the prediction. They add extra dimensions to the problem with frequent local minima and maxima. With this context, it is felt that the Support Vector Machine (SVM) may provide better prediction results with hyperplanes and generalization. Polynomial regression is also tried.

Figure 1 Illustrates how the infection rate is increased state wise in India. Figure 1(a) represents the state-wise infection on 14th of April and Figure 1(b) represents the state-wise infection on the 7th of June. A relatively darker shade in colour demonstrates an increase in infection.
2 Methodology and Data
Data are collected from https://www.covid19india.org/ which is the official site of Government of India. Tensor flow library is used to create the models. Data were taken until the 1st of July, 2020. An algorithmic comparison is performed with LSTM to demonstrate that SVM outperforms LSTM with a smaller data set with discrete and sparse events that bear no memory in general even though they have high impacts on the results. Models are created with the lockdown data (Table 1) for each of India’s lockdown stages. The results are compared to demonstrate the effectiveness of various preventive measures taken in each of those lockdown stages. A consolidated model is created with all the available data until 1st of July and a prediction on the spread of COVID-19 in India is performed for a period of 30 days in advance. It is observed that Polynomial Regression provides comparable results with this consolidated dataset and therefore, a similar prediction is also performed alongside SVM. The SVM model is further coupled with SIR model of epidemiology to understand the projected Susceptible, Infected and Recovered cases of COVID-19 in India over the next year.
2.1 Polynomial Regression
The polynomial regression is an exclusive method that operates for multiple linear regression. It is mainly used to identify the non-linear association between polynomial dependent and independent variables. It replaces linear regression into polynomial basis e.g. ] (Magee, 2016). With polynomial features degree of 4, more than 99% of accuracy is achieved.
2.2 SVM
SVM optimizes hyperplane distances and the margins. Hyperplane distance can be maximized based on two-class boundaries using the following Equation (1) (Hassanien et al., 2020)
| (1) |
For . For handling the non-linearity as displayed in Equation (2) a positive slack variable
| (2) |
Accordingly, objective function will be as an Equation (3) and m represent value 0
| (3) |
W represents weights matrix; A is the input vector, v represents bias vector, B is the output classes, is represent a slack variable.
The kernel function of the polynomial is described by (, where d is specified by parameter degree, r by coef. A polynomial degree used here is 5. The higher degree allows the polynomial kernel with more flexible decision boundaries. Kernel coefficient value of gamma is taken as 0.01, epsilon value is 1, and C is 0.01. The gamma parameters inverse the radius of influence of samples selected by the model as a support vector. Data are split into 3 disjoint sets of randomly selected samples from the actual data for training, testing and validation. Models are calibrated and validated as per standards and avoid overfitting, which is critical for a smaller data set.
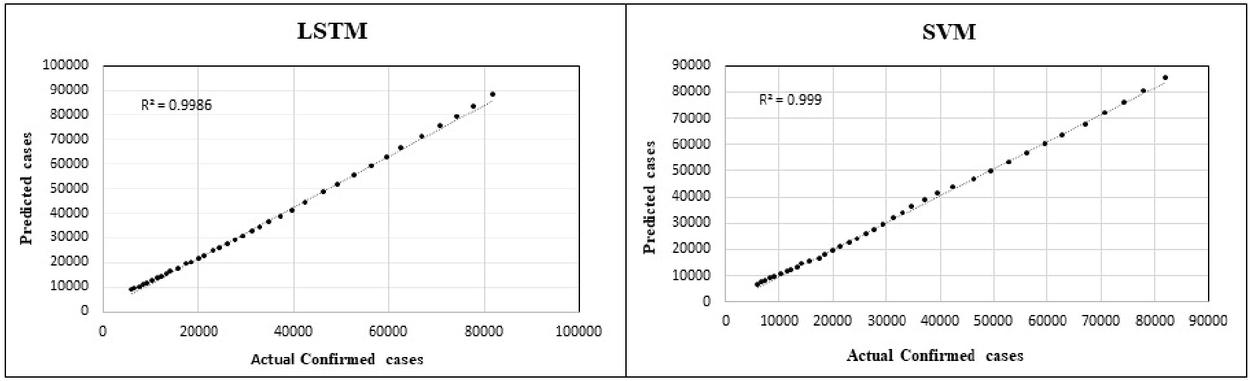
Figure 2 Validation and Model comparison LSTM vs SVM.
3 Results and Discussion
Figure 2 suggests while SVM has a precision of 0.999, LSTM stands at 0.9986. LSTM networks are a specialization of Recurrent Neural Networks (RNN) capable of capturing long-term dependencies and making use of past and future memories. However, the COVID-19 data set is relatively smaller and has multiple sparse and discrete events such as sudden religious gatherings, migration of workers, and transition to one lock downstage to a new lockdown stage with different preventive measures and its implementations. In the contrary SVM is ideal for such sparse set as it can classify the events and its relations using hyperplanes in their respective contexts of high dimensionalities.
Table 1 captures the various stages of lockdowns in India and their respective preventive measures taken by India’s Government to address the threat of COVID-19. The measures and their implementations of various lockdowns are realized in different ways due to India’s socio-economic diversity: be it federal structures where different policymakers govern different states or be it the diversified population of India that has their individual understanding and interpretations of lockdown guidelines. To take care of these diversities and identify their respective impacts models, they are developed, and predictions are made for each lockdown scenario.
Figure 3(a) suggests had India continued with the measures of Lockdown-1, the COVID-19 infection curve would have been significantly flattened by mid of May itself with a peak in the 1st week of May. Contrary to Figure 3(a), none of the infection curves for other 3 lockdown stages in India exhibit any flattening. With the measures of Lockdown 2, India would have reached 0.5 million COVID-19 confirmed cases by 26th of June (Figure 3(b)). Whereas the same half a million mark would have been reached by 24th June (Figure 3(c)) and 30th June (Figure 3(d)) with the respective measures of Lockdown 3 and Lockdown 4 respectively.
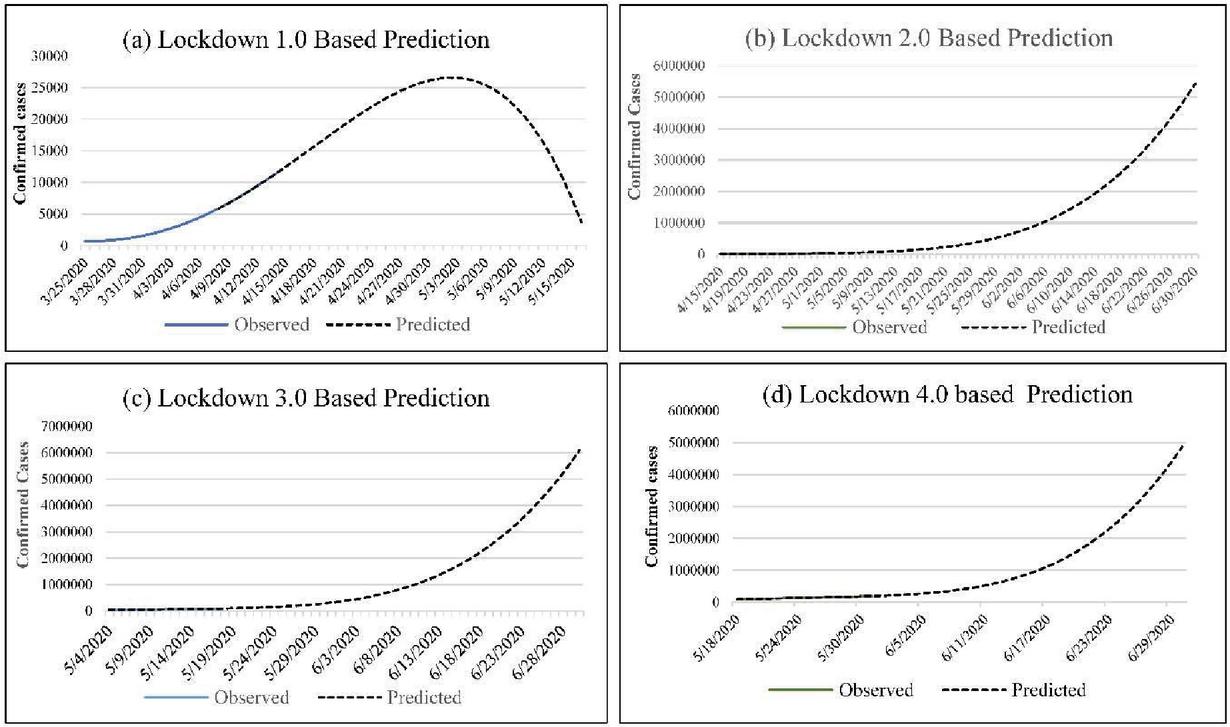
Figure 3 Predictions based on various lockdown stages (a) assessment based on lockdown-1 (b) assessment based on lockdown-2 (c) assessment based on lockdown-3 (d) assessment based on lockdown-4.
The result suggests that even though Lockdown-1 contained the spread of COVID-19 in India, rest of the lockdown measures (stage 2, 3 and 4) have failed to do so (Sarkar et al., 2020). Incidentally, the exodus of migrant workers started taking place in the Lockdown-2 stage where millions of migrant daily workers started moving towards their home towns by their own means (through bicycle, walking, cargo vehicles, etc.) there were restrictions on movements of vehicles. In addition to this, the majority of the diversified population were stressed financially and emotionally and could not comply with the government’s guidelines. Religious gathering was restricted. However, that was violated on various occasions. There were various such events too.
A final model (Figure 4 with an R value of 0.9998) is developed by integrating all the lockdown stages and the data until 13 October 2020. It suggests that COVID-19 confirmed cases will reach the 8 million mark by 27 of October 2020 (Figure 4(b)). This could be due to the rapid increase in infections once the lockdown is lifted on the 1st of June, 2020. In (Figure 4(b)) shown SVM model results represent increasing Recovery rate decreases the speed of confirmed cases in continuity and February almost 90% of COVID-19 confirmed active cases will be changed into recover cases. Considering the data’s veracity, we tried the Polynomial Regression Model (Figure 4(c)) with an R value of 0.96. It is found that the Polynomial Regression model is suggesting COVID-19 90%cases end in January and this model predict COVID-19 90% cases end earlier in comparison to SVM model results (Figure 4(b)).
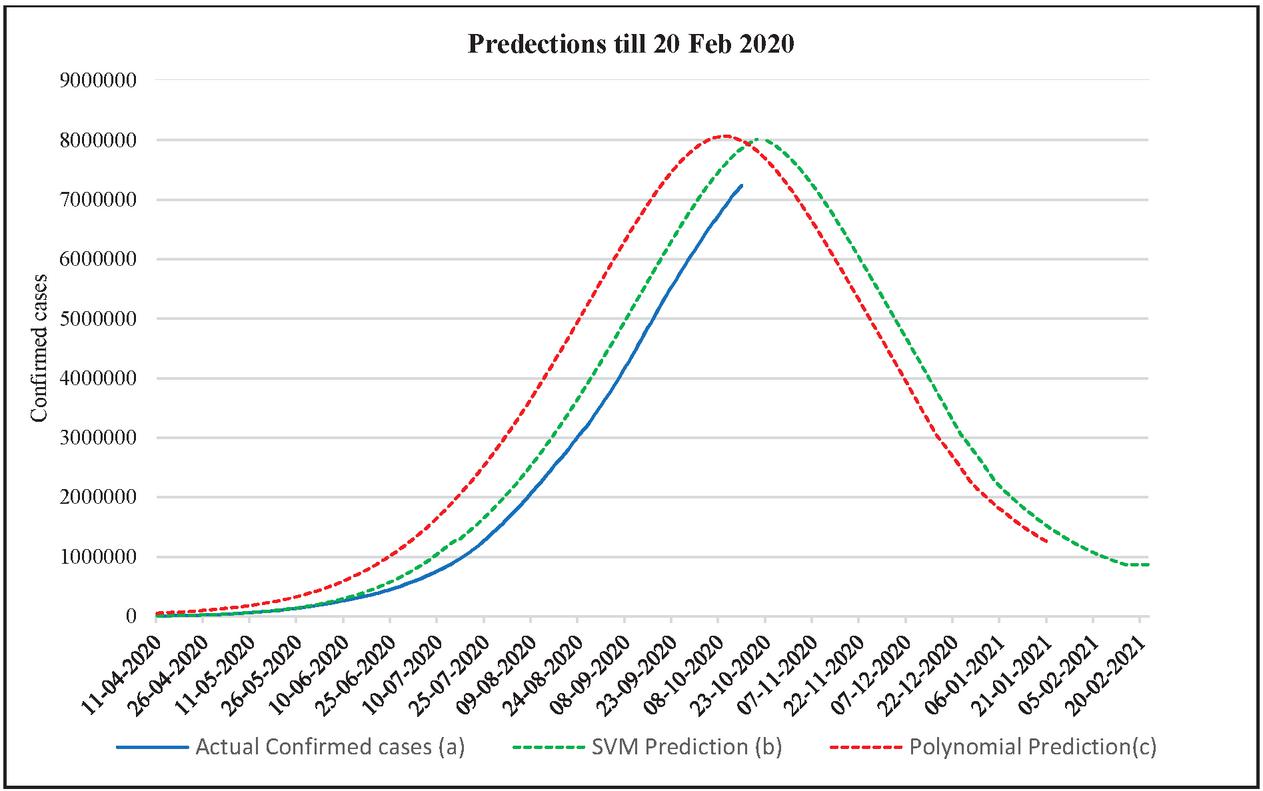
Figure 4 Predictions based on all data until 4 Dec 2020. (a) Observed data (b) Prediction using SVM (c) Prediction using Polynomial Regression.
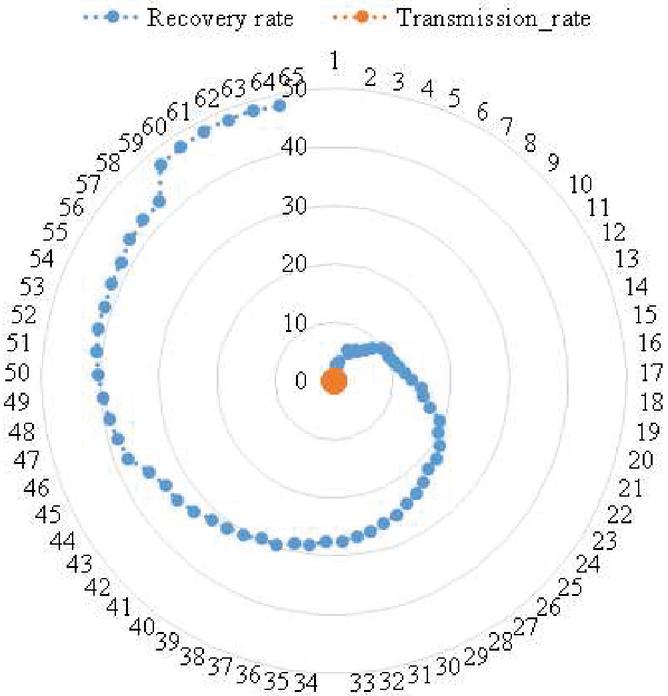
Figure 5 Transmission rate vs Recovery rate.
Overall, the data seem quite alarming and do not exhibit any dampening of the curve. This requires the attention of the policymakers and the general population who failed to comply to the Lockdown guidelines.
Figure 5 suggests a recovery rate of 48% on the 65th day after 4th lockdown. With the findings (Figures 3 and 4) of the data have driven machine learning model, a SIR (Susceptible, Infected and Recovered) model of epidemiology which is an analytical model, is developed to identify the lifecycle of this pandemic in India. The model represents the following equations:
| (4) | ||
| (5) | ||
| (6) |
Where S represents susceptible, I infected, and R recovered. t represents time with initial value 0. The incubation period of COVID-19, which is the time between exposure to the virus and becoming infected with symptoms, is considered 5–6 days (Culp, 2020). Incubation period represented by . where ‘a’ represents fixed transmission rate and it is assumed that a fixed fraction ‘b’ of the infected group will recover during any given time.
Table 2 Description various scenarios considered in SIR models
| Scenarios | Transmission Rate | Recovery Rate | Incubation Period |
| CN1-Actual condition | 1.06 | 0.48 | 0.19 |
| CN2 | 1.01 | 0.53 | 0.17 |
| CN3 | 0.96 | 0.58 | 0.14 |
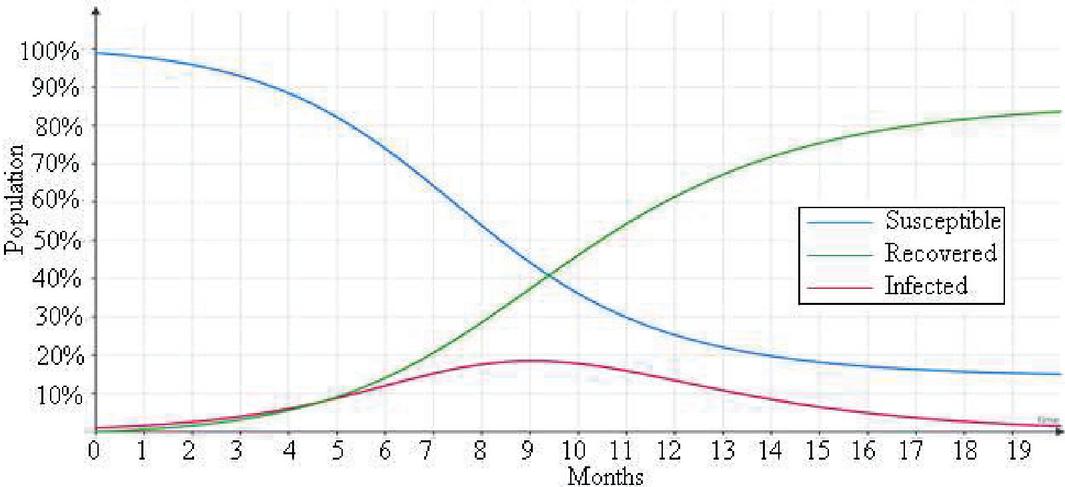
Figure 6 SIR model with actual condition.
The result (Figure 6) suggests that 70% of the population will be infected in India before a flattening of the curve is achieved with the current transmission rate. Therefore, the peak is quite far and expected to happen between 9th and 10th months from the start of the pandemic in India, which is tentatively at the end of December 2020.
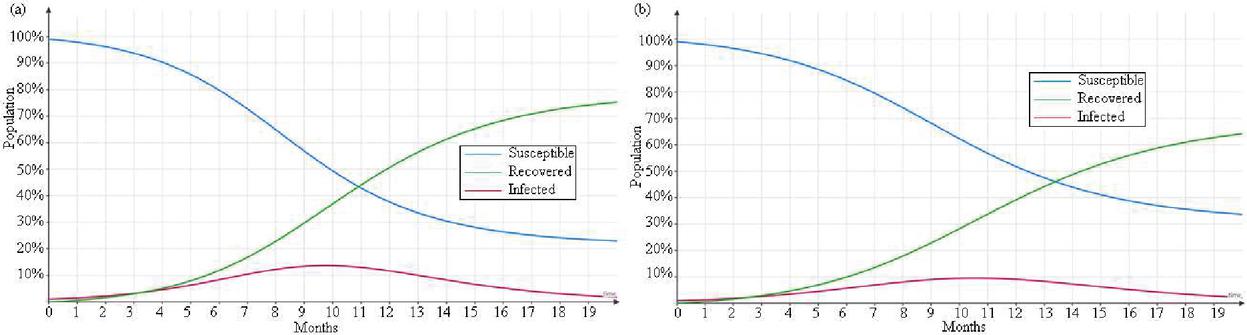
Figure 7 SIR model with anticipated scenarios: (a) CN2 (b) CN3.
The model is further run for two more scenarios (CN2 and CN3 as described in Table 2) with a step decrease of 0.05 in the infection rate. The results (Figure 7) suggest in scenario 2, 55% of the population in India will get infected by February 2021 before it slows down. In scenario 3, 65% of the population is infected, and recovery overcomes it. SIR model provides more accurate results (Roda et al., 2020). However, according to the result of this research (A. Singhal et al., 2020) estimate in India COVID-19 cases End in December.
4 Conclusion
The study illustrates how the prediction accuracy which is very critical to the COVID-19 analyses can be better using SVM and Polynomial Regression model. It further suggests while lockdown-1 which was a complete lockdown has been effective in India, the other stages of lockdowns could not contain the infection curve. The relaxations allowed as part of lockdown 2, 3 and 4 have adversely affected the fight against COVID-19 in India. Had India continued with lockdown 1, the curve could have been flattened by now. Therefore, future lockdowns in containment areas have to be absolute in nature without relaxation as it does not seem to work in the Indian socio-economic context. The study suggests that around 70% of the population will be infected and the peak is quite far from now and will arrive by the end of this year. This study is performed for research only. This study show performance of different models. This study provides available COVID-19 data and trained or tested on given models than through comparisons to check which model provides more accurate results. And the prediction for the future is based on current assumption and condition would be continued.
Compliance with Ethical Standards
Conflict of interest on behalf of all authors, the corresponding author states that there is no conflict of interest.
References
Barmparis, G. D., and Tsironis, G. P. (2020). Estimating the infection horizon of COVID-19 in eight countries with a data-driven approach. Chaos, Solitons and Fractals, 135, 109842. https://doi.org/10.1016/j.chaos.2020.109842
Chakraborty, T., and Ghosh, I. (2020). Real-time forecasts and risk assessment of novel coronavirus (COVID-19) cases: A data-driven analysis. MedRxiv, 135, 2020.04.09.20059311. https://doi.org/10.1101/2020.04.09.20059311
Chatterjee, K., Chatterjee, K., Kumar, A., and Shankar, S. (2020). Healthcare impact of COVID-19 epidemic in India: A stochastic mathematical model. Medical Journal Armed Forces India, 76(2), 147–155. https://doi.org/10.1016/j.mjafi.2020.03.022
Culp, W. C. (2020). Coronavirus Disease 2019. A & A Practice, 14(6), e01218. https://doi.org/10.1213/xaa.0000000000001218
Ghosh, A., Gupta, R., and Misra, A. (2020). Telemedicine for diabetes care in India during COVID19 pandemic and national lockdown period: Guidelines for physicians. Diabetes and Metabolic Syndrome: Clinical Research and Reviews, 14(4), 273–276. https://doi.org/10.1016/j.dsx.2020.04.001
Hassanien, A. E., Mahdy, L. N., Ezzat, K. A., Elmousalami, H. H., and Ella, H. A. (2020). Automatic X-ray COVID-19 Lung Image Classification System based on Multi-Level Thresholding and Support Vector Machine. MedRxiv, 2020.03.30.20047787. https://doi.org/10.1101/2020.03.30.20047787
Li, L., Yang, Z., Dang, Z., Meng, C., Huang, J., Meng, H., Wang, D., Chen, G., Zhang, J., Peng, H., and Shao, Y. (2020). Propagation analysis and prediction of the COVID-19. Infectious Disease Modelling, 5, 282–292. https://doi.org/10.1016/j.idm.2020.03.002
Magee, L. (2016). Nonlocal Behavior in Polynomial Regressions Author ( s ): Lonnie Magee Published by: Taylor & Francis , Ltd . on behalf of the American Statistical Association Stable URL: http://www.jstor.org/stable/2685560 Nonlocal Behavior in Polynomial Regressions. 52(1), 20–22.
Mahendra Dev, S., and Sengupta, R. (2020). Covid-19: Impact on the Indian Economy. April. https://time.com/5818819/imf-coronavirus-economic-collapse/
Pandey, G., Chaudhary, P., Gupta, R., and Pal, S. (2019). SEIR and Regression Model based COVID-19 outbreak predictions in India. 1–10.
Paul, A., Chatterjee, S., and Bairagi, N. (2020). Prediction on Covid-19 epidemic for different countries: Focusing on South Asia under various precautionary measures. MedRxiv, March, 2020.04.08.20055095. https://doi.org/10.1101/2020.04.08.20055095
Petropoulos, F., and Makridakis, S. (2020). Forecasting the novel coronavirus COVID-19. PLoS ONE, 15(3), 1–8. https://doi.org/10.1371/journal.pone.0231236
Ray, D., Salvatore, M., Bhattacharyya, R., Wang, L., Mohammed, S., Purkayastha, S., Halder, A., Rix, A., Barker, D., Kleinsasser, M., Zhou, Y., Song, P., Bose, D., Banerjee, M., Baladandayuthapani, V., Ghosh, P., and Mukherjee, B. (2020). Predictions, role of interventions and effects of a historic national lockdown in India’s response to the COVID-19 pandemic: data science call to arms. MedRxiv, 2020.04.15.20067256. https://doi.org/10.1101/2020.04.15.20067256
Remuzzi, A., and Remuzzi, G. (2020). Health Policy COVID-19 and Italy: what next? The Lancet, 395(10231), 1225–1228. https://doi.org/10.1016/S0140-6736(20)30627-9
Ribeiro, M. H. D. M., da Silva, R. G., Mariani, V. C., and Coelho, L. dos S. (2020). Short-term forecasting COVID-19 cumulative confirmed cases: Perspectives for Brazil. Chaos, Solitons & Fractals, 135, 109853. https://doi.org/10.1016/j.chaos.2020.109853
Roda, W. C., Varughese, M. B., Han, D., and Li, M. Y. (2020). Why is it difficult to accurately predict the COVID-19 epidemic? Infectious Disease Modelling, 5, 271–281. https://doi.org/10.1016/j.idm.2020.03.001
Roosa, K., Lee, Y., Luo, R., Kirpich, A., Rothenberg, R., Hyman, J. M., Yan, P., and Chowell, G. (2020). Real-time forecasts of the COVID-19 epidemic in China from February 5th to February 24th, 2020. Infectious Disease Modelling, 5, 256–263. https://doi.org/10.1016/j.idm.2020.02.002
Sarkar, K., Khajanchi, S., and Nieto, J. J. (2020). Modeling and forecasting the COVID-19 pandemic in India. Chaos, Solitons and Fractals, 139, 1–16. https://doi.org/10.1016/j.chaos.2020.110049
Singh, S., Parmar, K. S., Kumar, J., and Makkhan, S. J. S. (2020). Development of New Hybrid Model of Discrete Wavelet Decomposition and Autoregressive Integrated Moving Average (ARIMA) Models in Application to One Month Forecast the Casualties Cases of COVID-19. Chaos, Solitons, and Fractals, 135, 109866. https://doi.org/10.1016/j.chaos.2020.109866
Singhal, A., Singh, P., Lall, B., and Joshi, S. D. (2020). Modeling and prediction of COVID-19 pandemic using Gaussian mixture model. Chaos, Solitons and Fractals, 138, 110023. https://doi.org/10.1016/j.chaos.2020.110023
Singhal, T. (2020). A Review of Coronavirus Disease-2019 (COVID-19). Indian Journal of Pediatrics, 87(4), 281–286. https://doi.org/10.1007/s12098-020-03263-6
Tomar, A., and Gupta, N. (2020). Prediction for the spread of COVID-19 in India and effectiveness of preventive measures. Science of the Total Environment, 728, 138762. https://doi.org/10.1016/j.scitotenv.2020.138762
Biographies

Jaspreet Kaur is Bachelor of Technology (B.Tech) student in Computer science and Engineering at Sri Guru Granth Sahib World University, Punjab, India. She has wide interest in application development. She developed number of applications including Android apps and games. Her expertise includes C, C, Python, Java and TensorFlow. She focused on Machine Learning based application and algorithms development and successfully implemented it.

Pallavi Chattopadhyay is working as Assistant professor in the Department of Earth Sciences, Indian Institute of Technology Roorkee, Roorkee, India. She is an expert in HydroGeophysics. Her research interests are Near surface Geophysics and Sub surface geological controls. She has more than 10 years of experience in Artificial Intelligence and Machine Learning and has worked in various roles in India and in USA.

Lakhwinder Singh has wide expertise in Remote sensing and GIS. Area of Interest includes Machine Learning, Climate change and Hydrology. He has developed number of models for GIS. Having wide experience in number of Govt. of India Projects. Doing PhD at IIT Roorkee. Completed M.Tech in GIS in 2010, from BDU, Tiruchirappalli. He has number of technology followers on social media. Received International Award for scientific and online support contribution to the SWAT model at the 2018 from Texas A&M University, USA and USDA at Brussels, Belgium.

Kausik Chattopadhyay is currently working as Technical Officer III, ICC, at Indian Institute of Technology Roorkee. He has more than 20 years of experience in Software Development, Cyber Security, Big Data & Machine Learning. He has worked in various multinational companies in India as well as in USA. He holds a BTech in Computer Science and an MBA in Finance.

Nitin Mishra born in Roorkee, Haridwar District in 1979. He received the B.E. in Agricultural Engg. (2002) and M.Tech. in Irrigation Water Management (IIT Roorkee, 2013), Perusing PhD from Department of Civil Engineering, Graphic Era Deemed to be University, Dehradun, India. He is presently working as Assistant Professor Department of Civil Engineering, Graphic Era Deemed to be University, Dehradun 2013 onward. Nitin Mishra has published about 91 research papers in National and International Journals, Conferences and Book Chapters. He has guided 14 M.Tech and has conducted 15 Expert Lecture/Seminars/Workshops/Conferences. He received 07 Awards for his contribution in Teaching and Research. His main area of research interest is Irrigation Water Management, Climate Change, Remote Sensing and GIS Applications in Water Resources with a focus on efficient water resources management. He is an Editorial Board Member and Reviewer of many reputed international and national journals
Journal of Graphic Era University, Vol. 9_2, 121–136.
doi: 10.13052/jgeu0975-1416.922
© 2021 River Publishers